Charts & Methodology
Our findings draw on four integrated streams of analysis:
- Expert qualitative assessments by TAG’s senior specialists in Washington, Shanghai, Tokyo, Singapore, New Delhi, and Seoul, examining the macroeconomic, sectoral, political, social, and geopolitical dimensions of Hormuz disruptions.
- A systematic review of existing analysis and projections of the direct impacts of commodity shocks to date by leading institutions such as the International Monetary Fund, Organization for Economic Cooperation and Development, International Energy Agency, and U.S. Energy Information Agency. TAG systematically compared their scenario analyses to capture current debates, assess the consistency of different models, and identify key gaps. We also utilized prior findings as a benchmark to validate and stress-test our own analytical framework and conclusions.
- TAG’s proprietary dataset mapping countries’ absolute and relative exposure to supply shocks across multiple markets and commodities. Our underlying data set comes from the International Trade Centre (ITC), a joint multilateral agency that holds a shared mandate with the WTO and UNCTAD. We selected this source based on three criteria: (1) coverage through December 2025, (2) annual reporting in volumetric rather than dollar terms, and (3) institutional credibility with publicly accessible data. TAG’s data science team has cleaned and adapted the data to make observations comparable across countries, including systematically tracking and accounting for missing figures.
- Proprietary AI-powered scenario modeling, which combines advanced artificial intelligence with TAG’s in-house regional expertise to simulate how governments, firms, central banks, and other actors respond under crisis conditions. Rather than converging on a single prediction, the platform runs parallel scenarios simultaneously to map a range of plausible futures. By examining thousands of discrete moves, decisions, and second-order interactions, the system surfaces non-obvious risks and interdependencies that traditional analysis tends to miss. The result is not just a snapshot of where things stand today but a dynamic, forward-looking picture of how situations are likely to evolve.
TAG’s methodology, approach, and findings were reviewed by a distinguished external advisory committee of leading experts in economics and international affairs.
A note on our data:
Assessing commodity trade flows to and from the Gulf is inherently difficult — countries adapt in real time, rerouting supply chains and obscuring the true picture of their dependency. Our data collection efforts therefore focus on the status quo before the start of U.S. military operations: a detailed snapshot of what each country actually imported, from where, and in what volumes. That baseline reveals the depth of structural dependencies before any adaptation began, establishes which Indo-Pacific economies were most exposed at the moment of disruption, and provides the clearest benchmark against which future shifts in trade patterns can be measured.
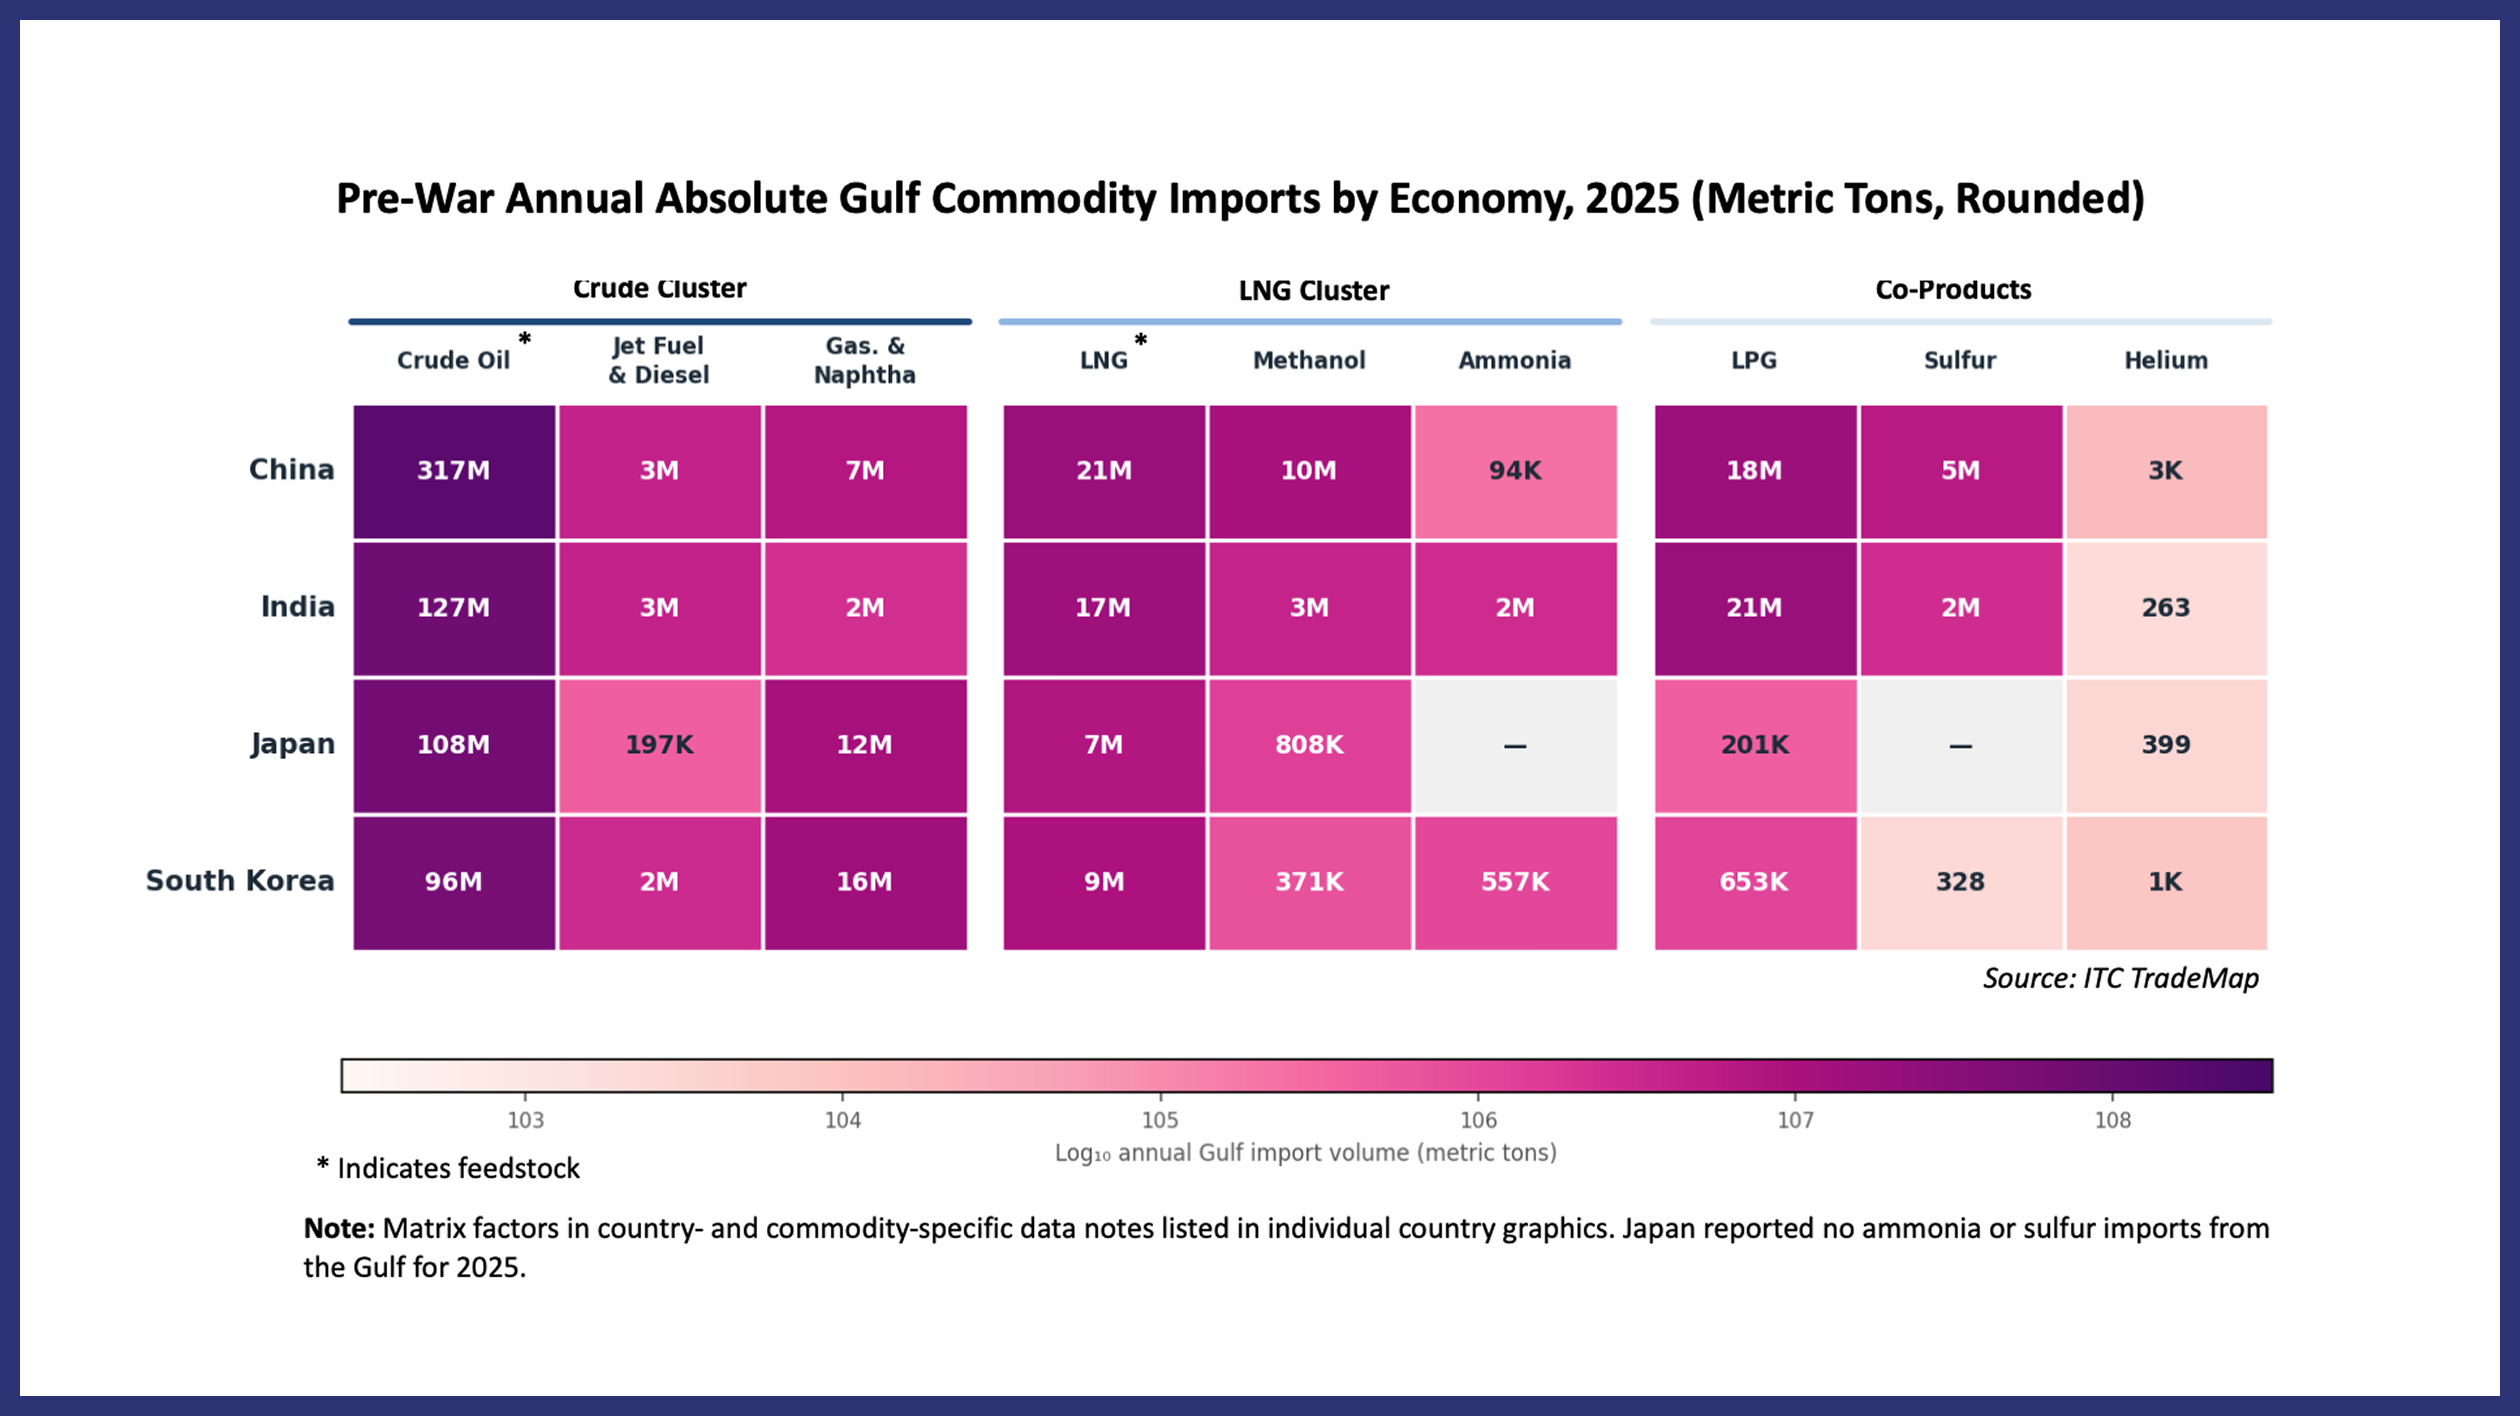
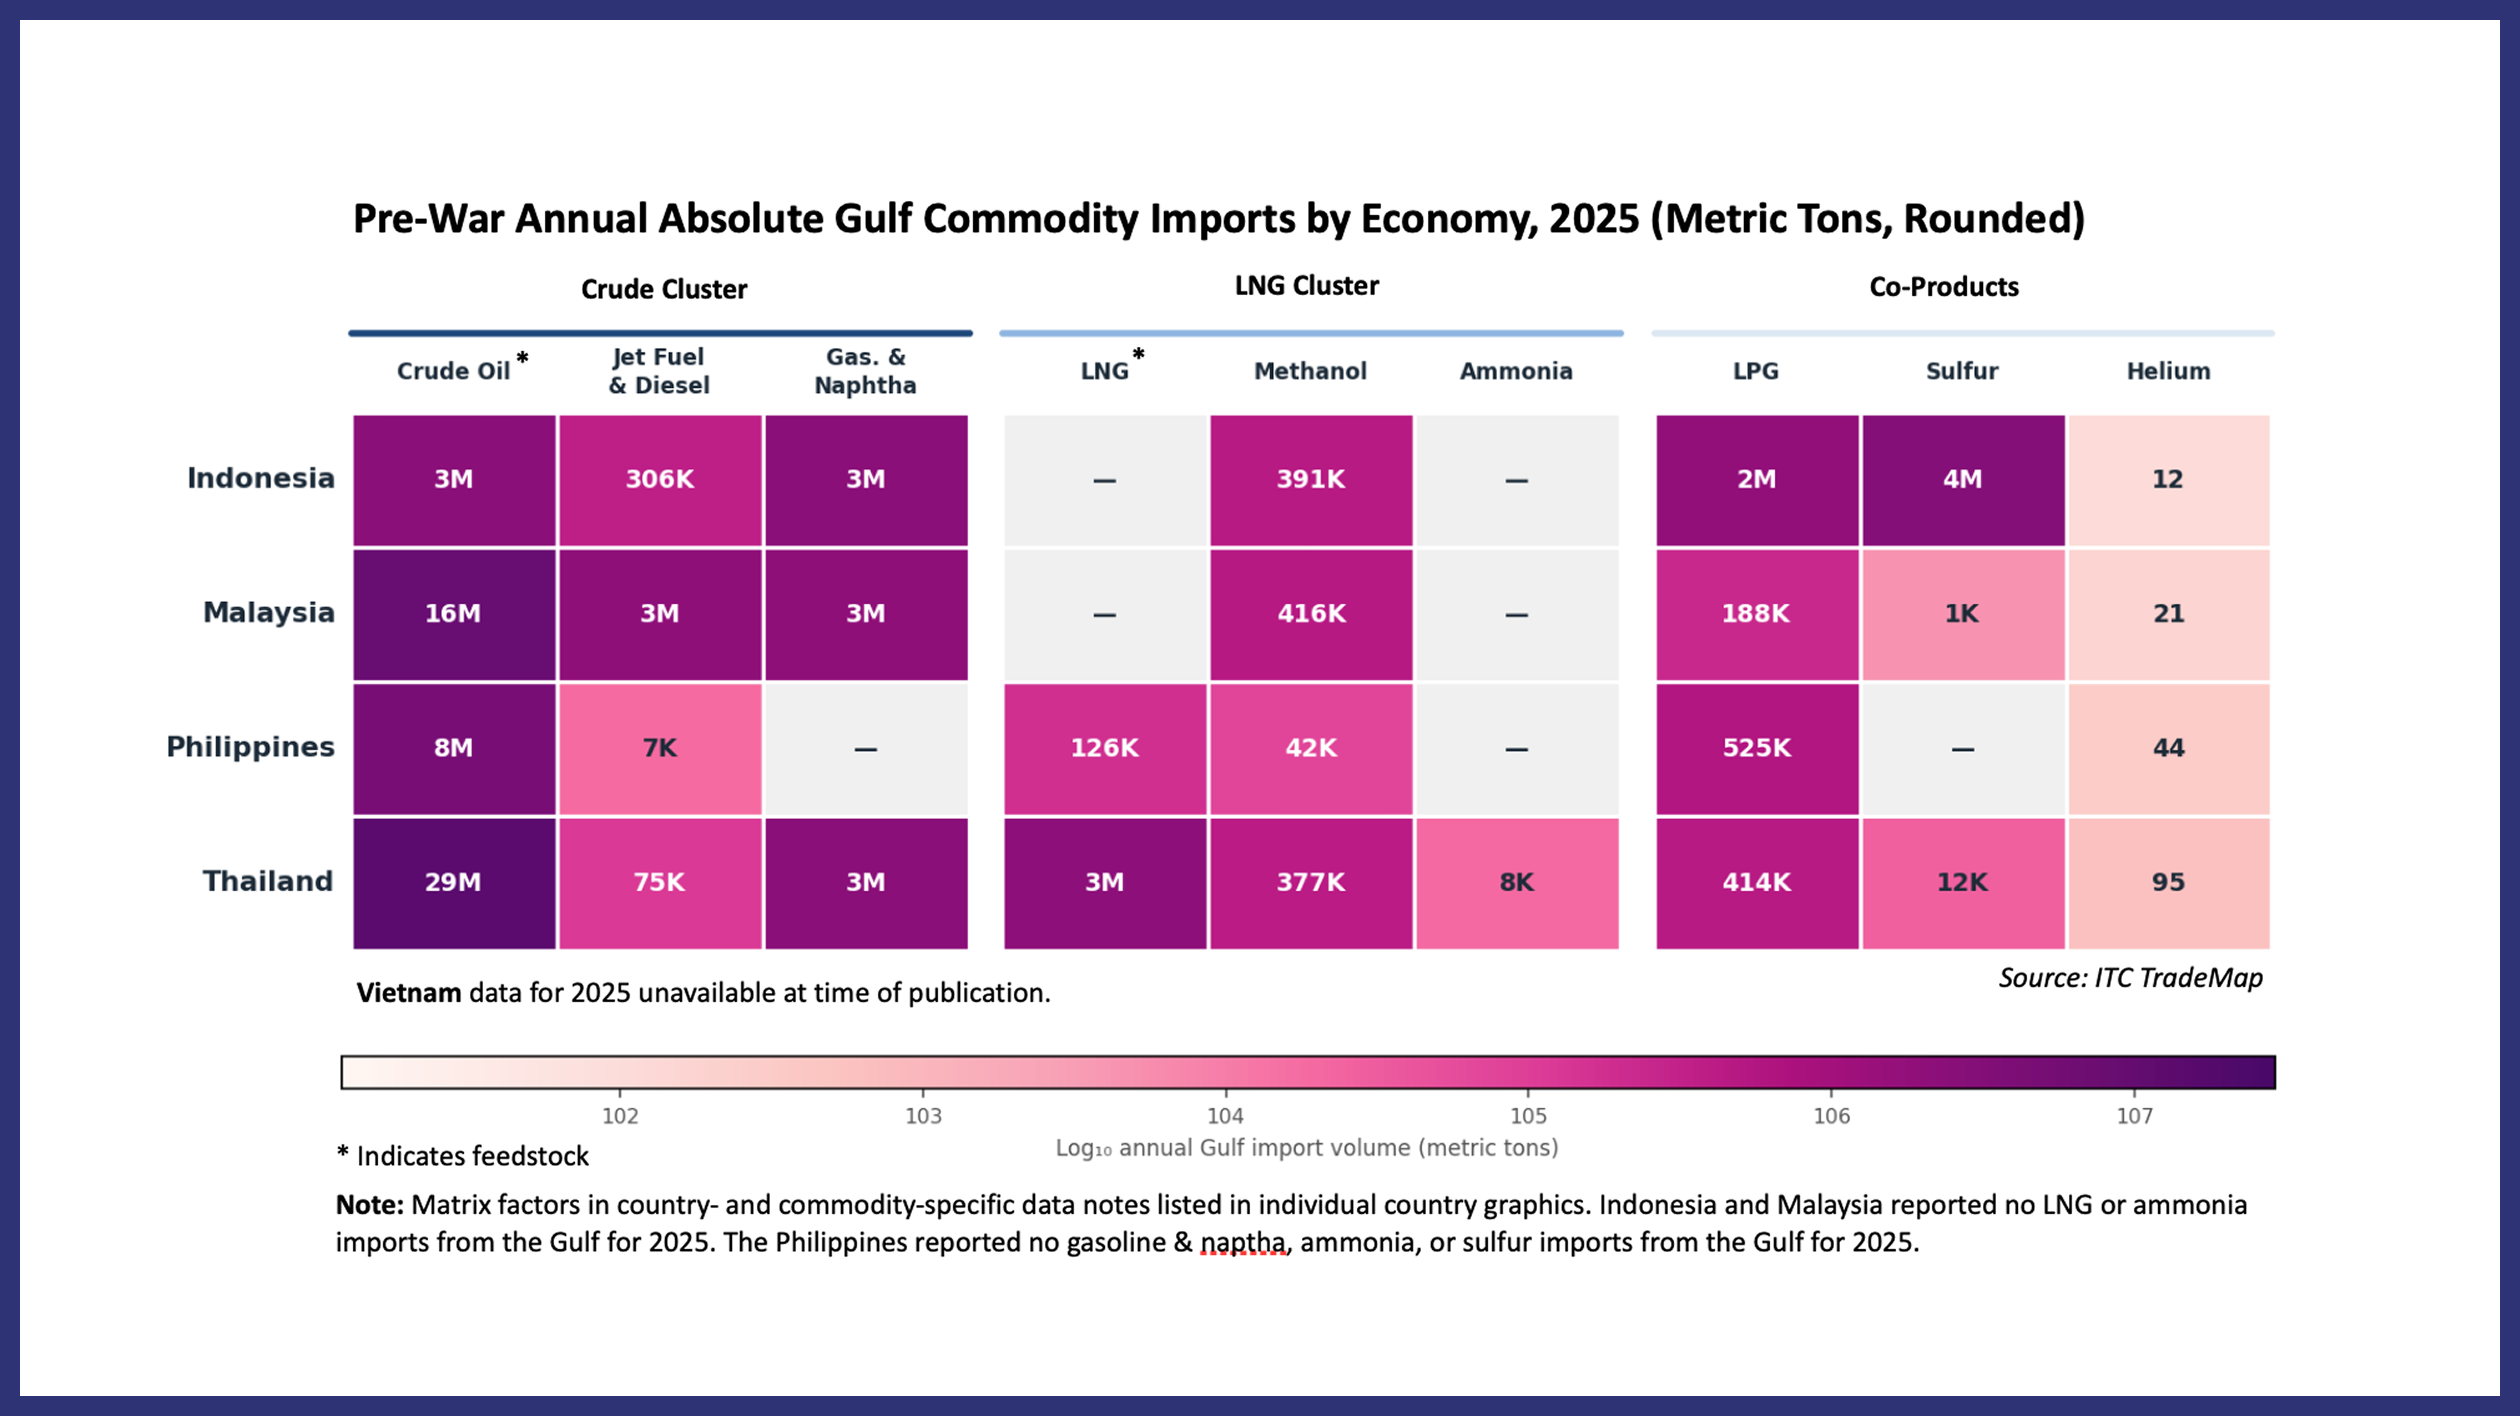
Gulf Import Volume Heatmaps
Northeast Asia & India
Southeast Asia
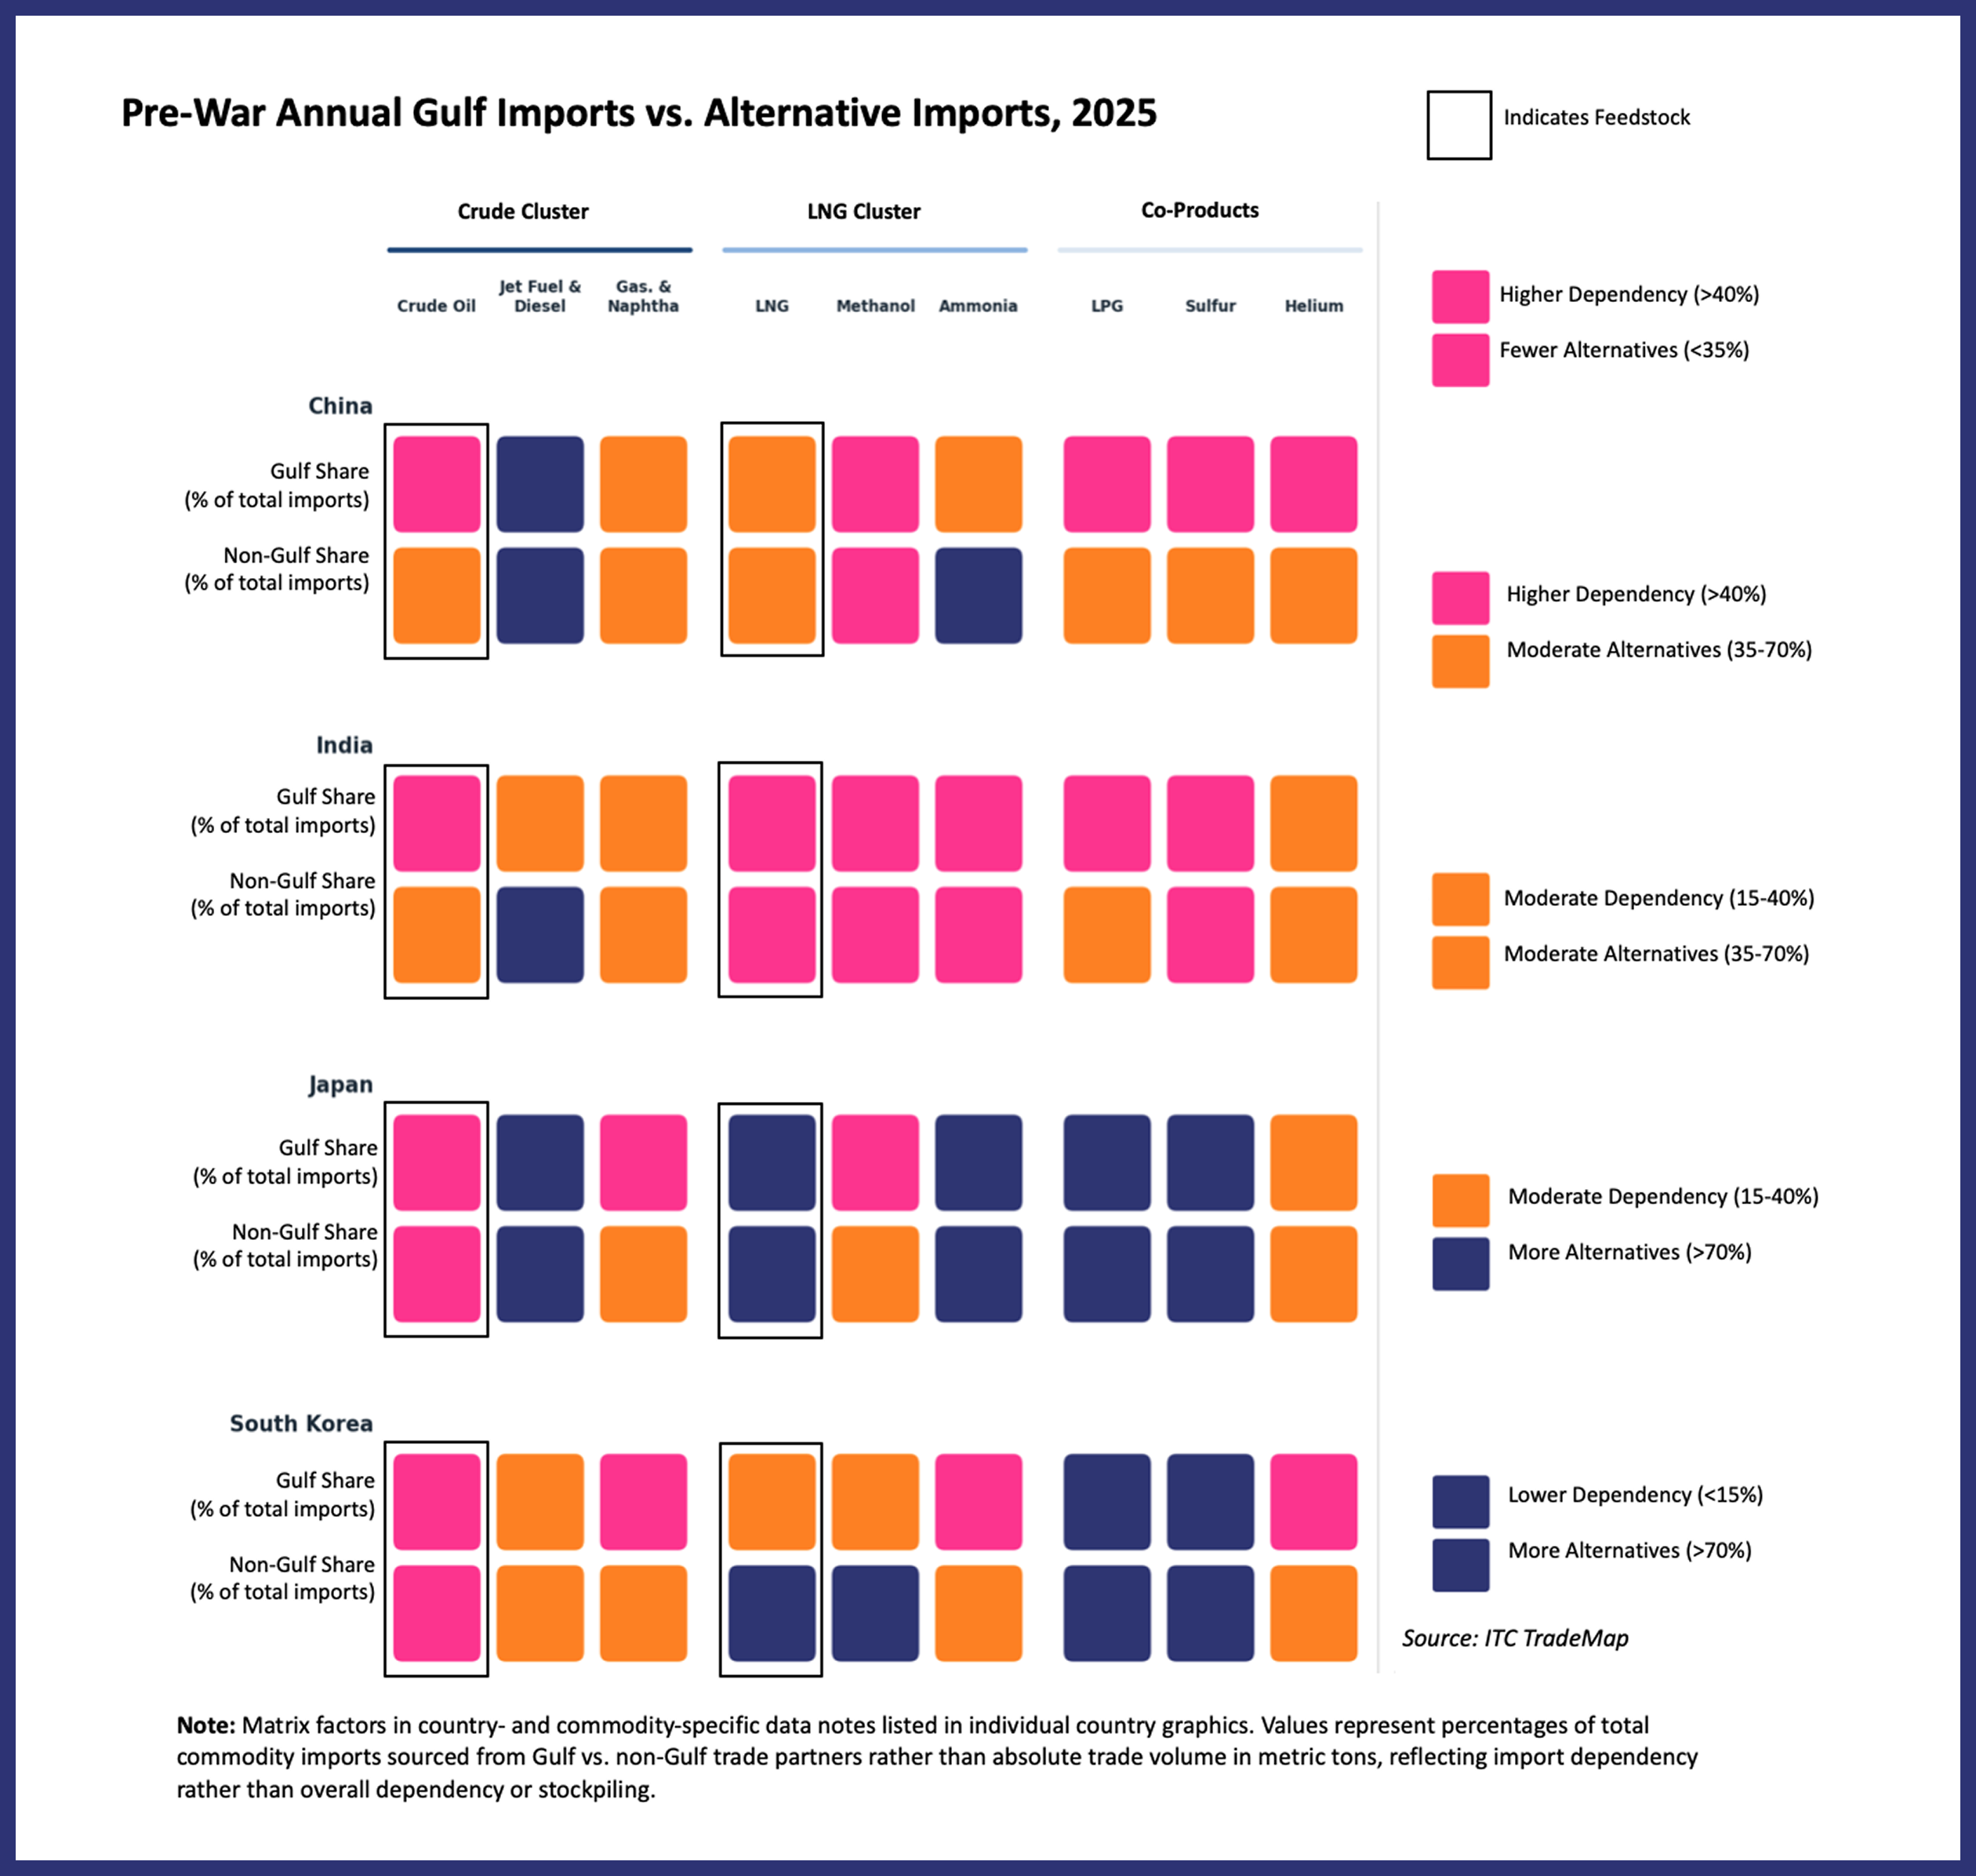
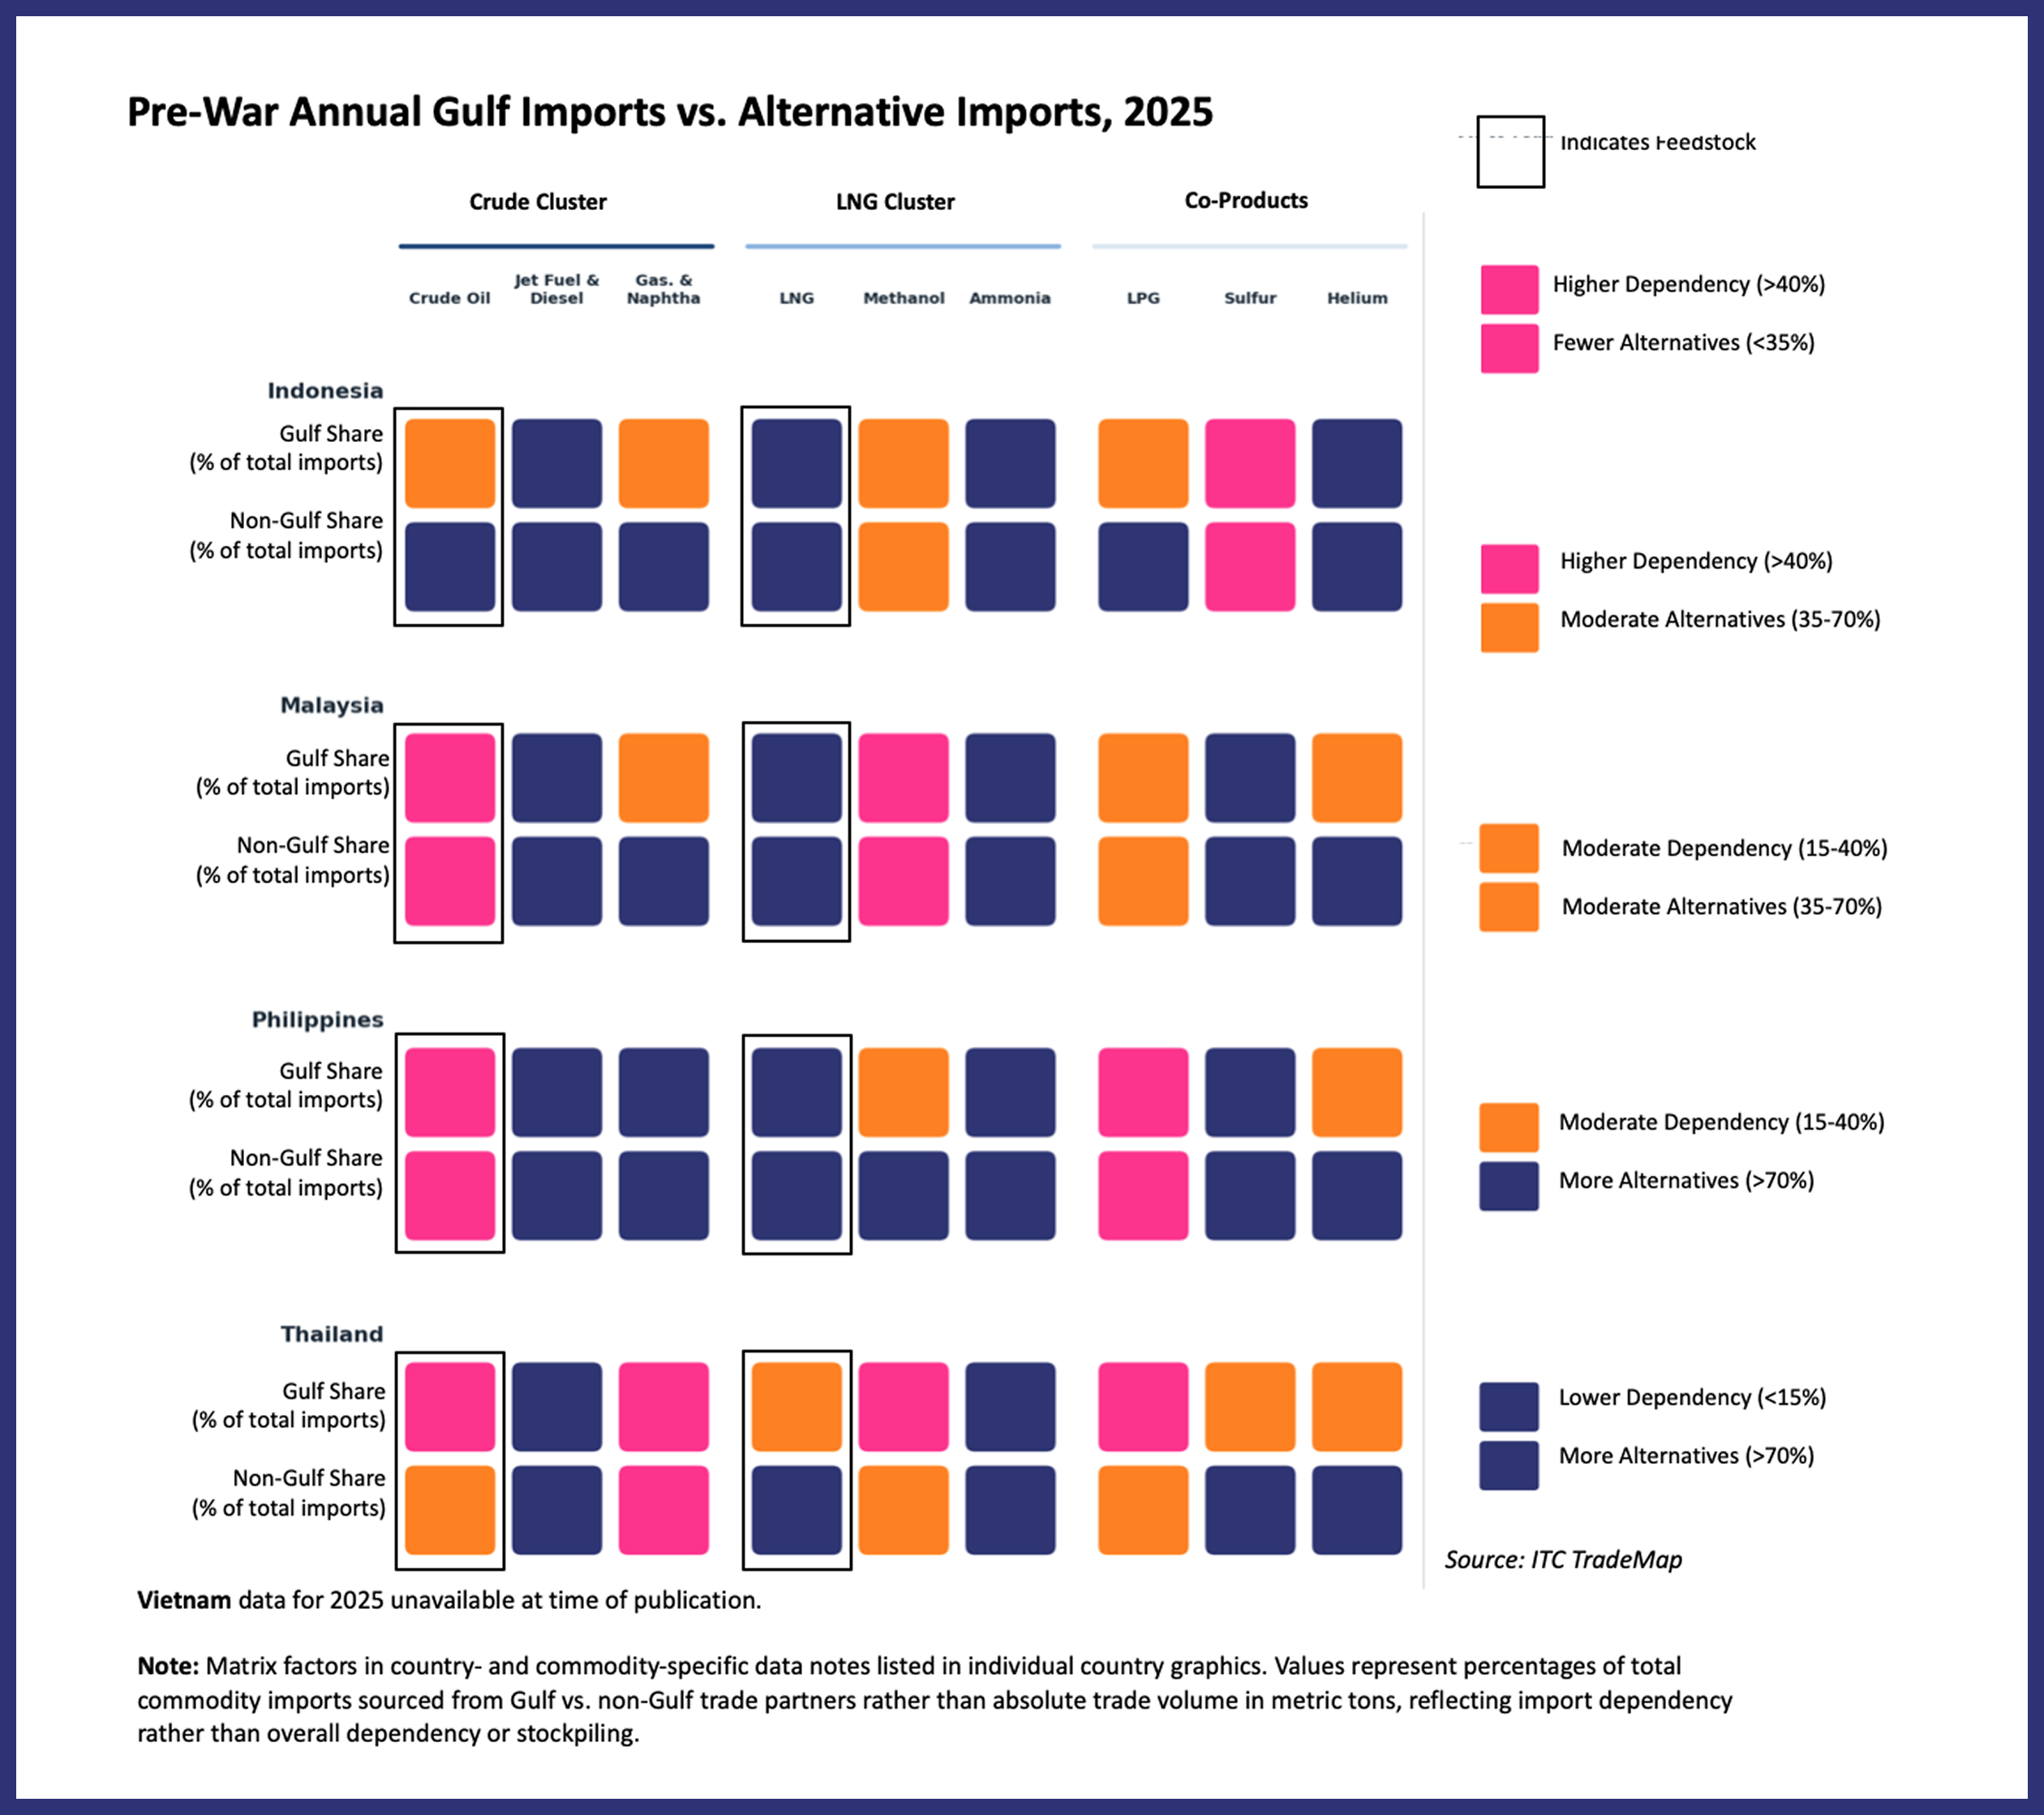
Pre-War Gulf Imports vs. Alternative Imports
Northeast Asia & India
Southeast Asia
Pre-War Gulf Commodity Import Dependencies
China
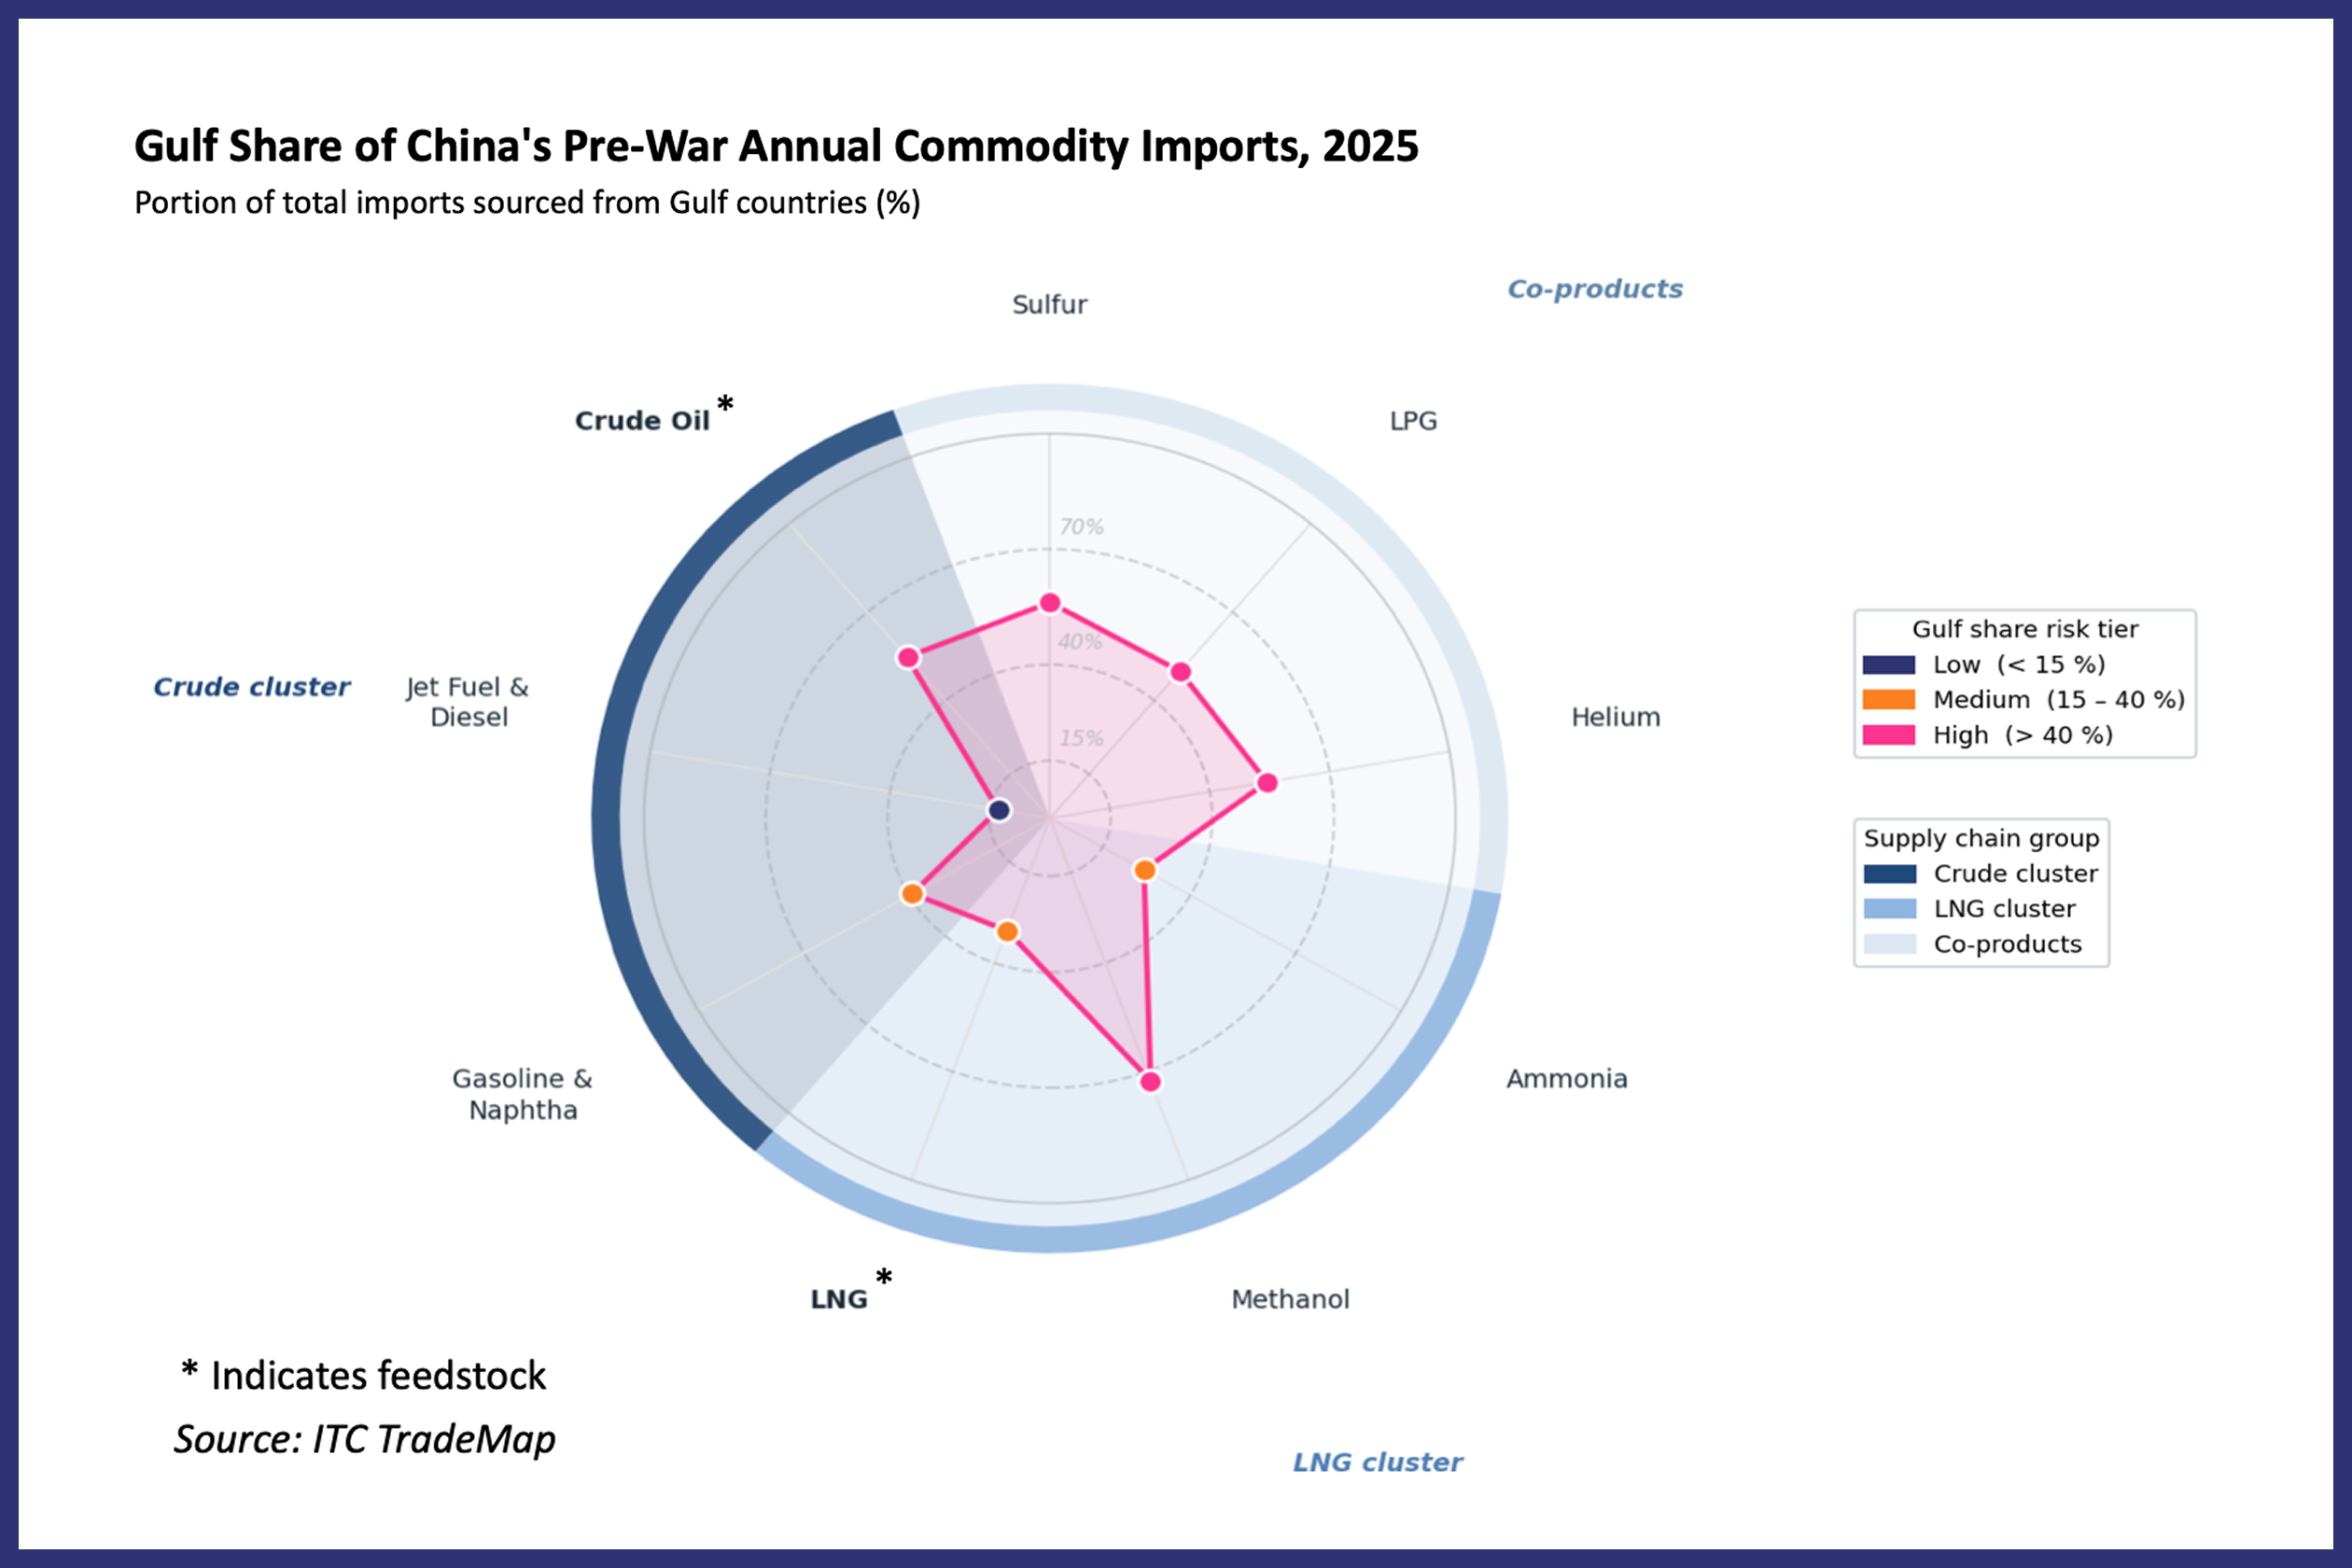
Crude Oil: Chinese crude oil imports from Iran are officially reported as zero. Experts estimate that Iran accounts for roughly 12–13 percent of China’s total crude imports, with Iranian-origin crude (shipped via Malaysia and Indonesia) likely averaging 1.38 million barrels per day (65–70 MT), according to Kpler. We incorporate this estimate in our calculations.
LPG: Chinese LPG imports from Iran are officially reported as zero. Much like crude, Iranian-origin LPG is shipped abroad via Malaysia and Indonesia. Kpler estimates that China imports approximately 50 percent of its LPG imports from the Gulf, including Iran. This figure is close to the officially reported value of around 49 percent.
India
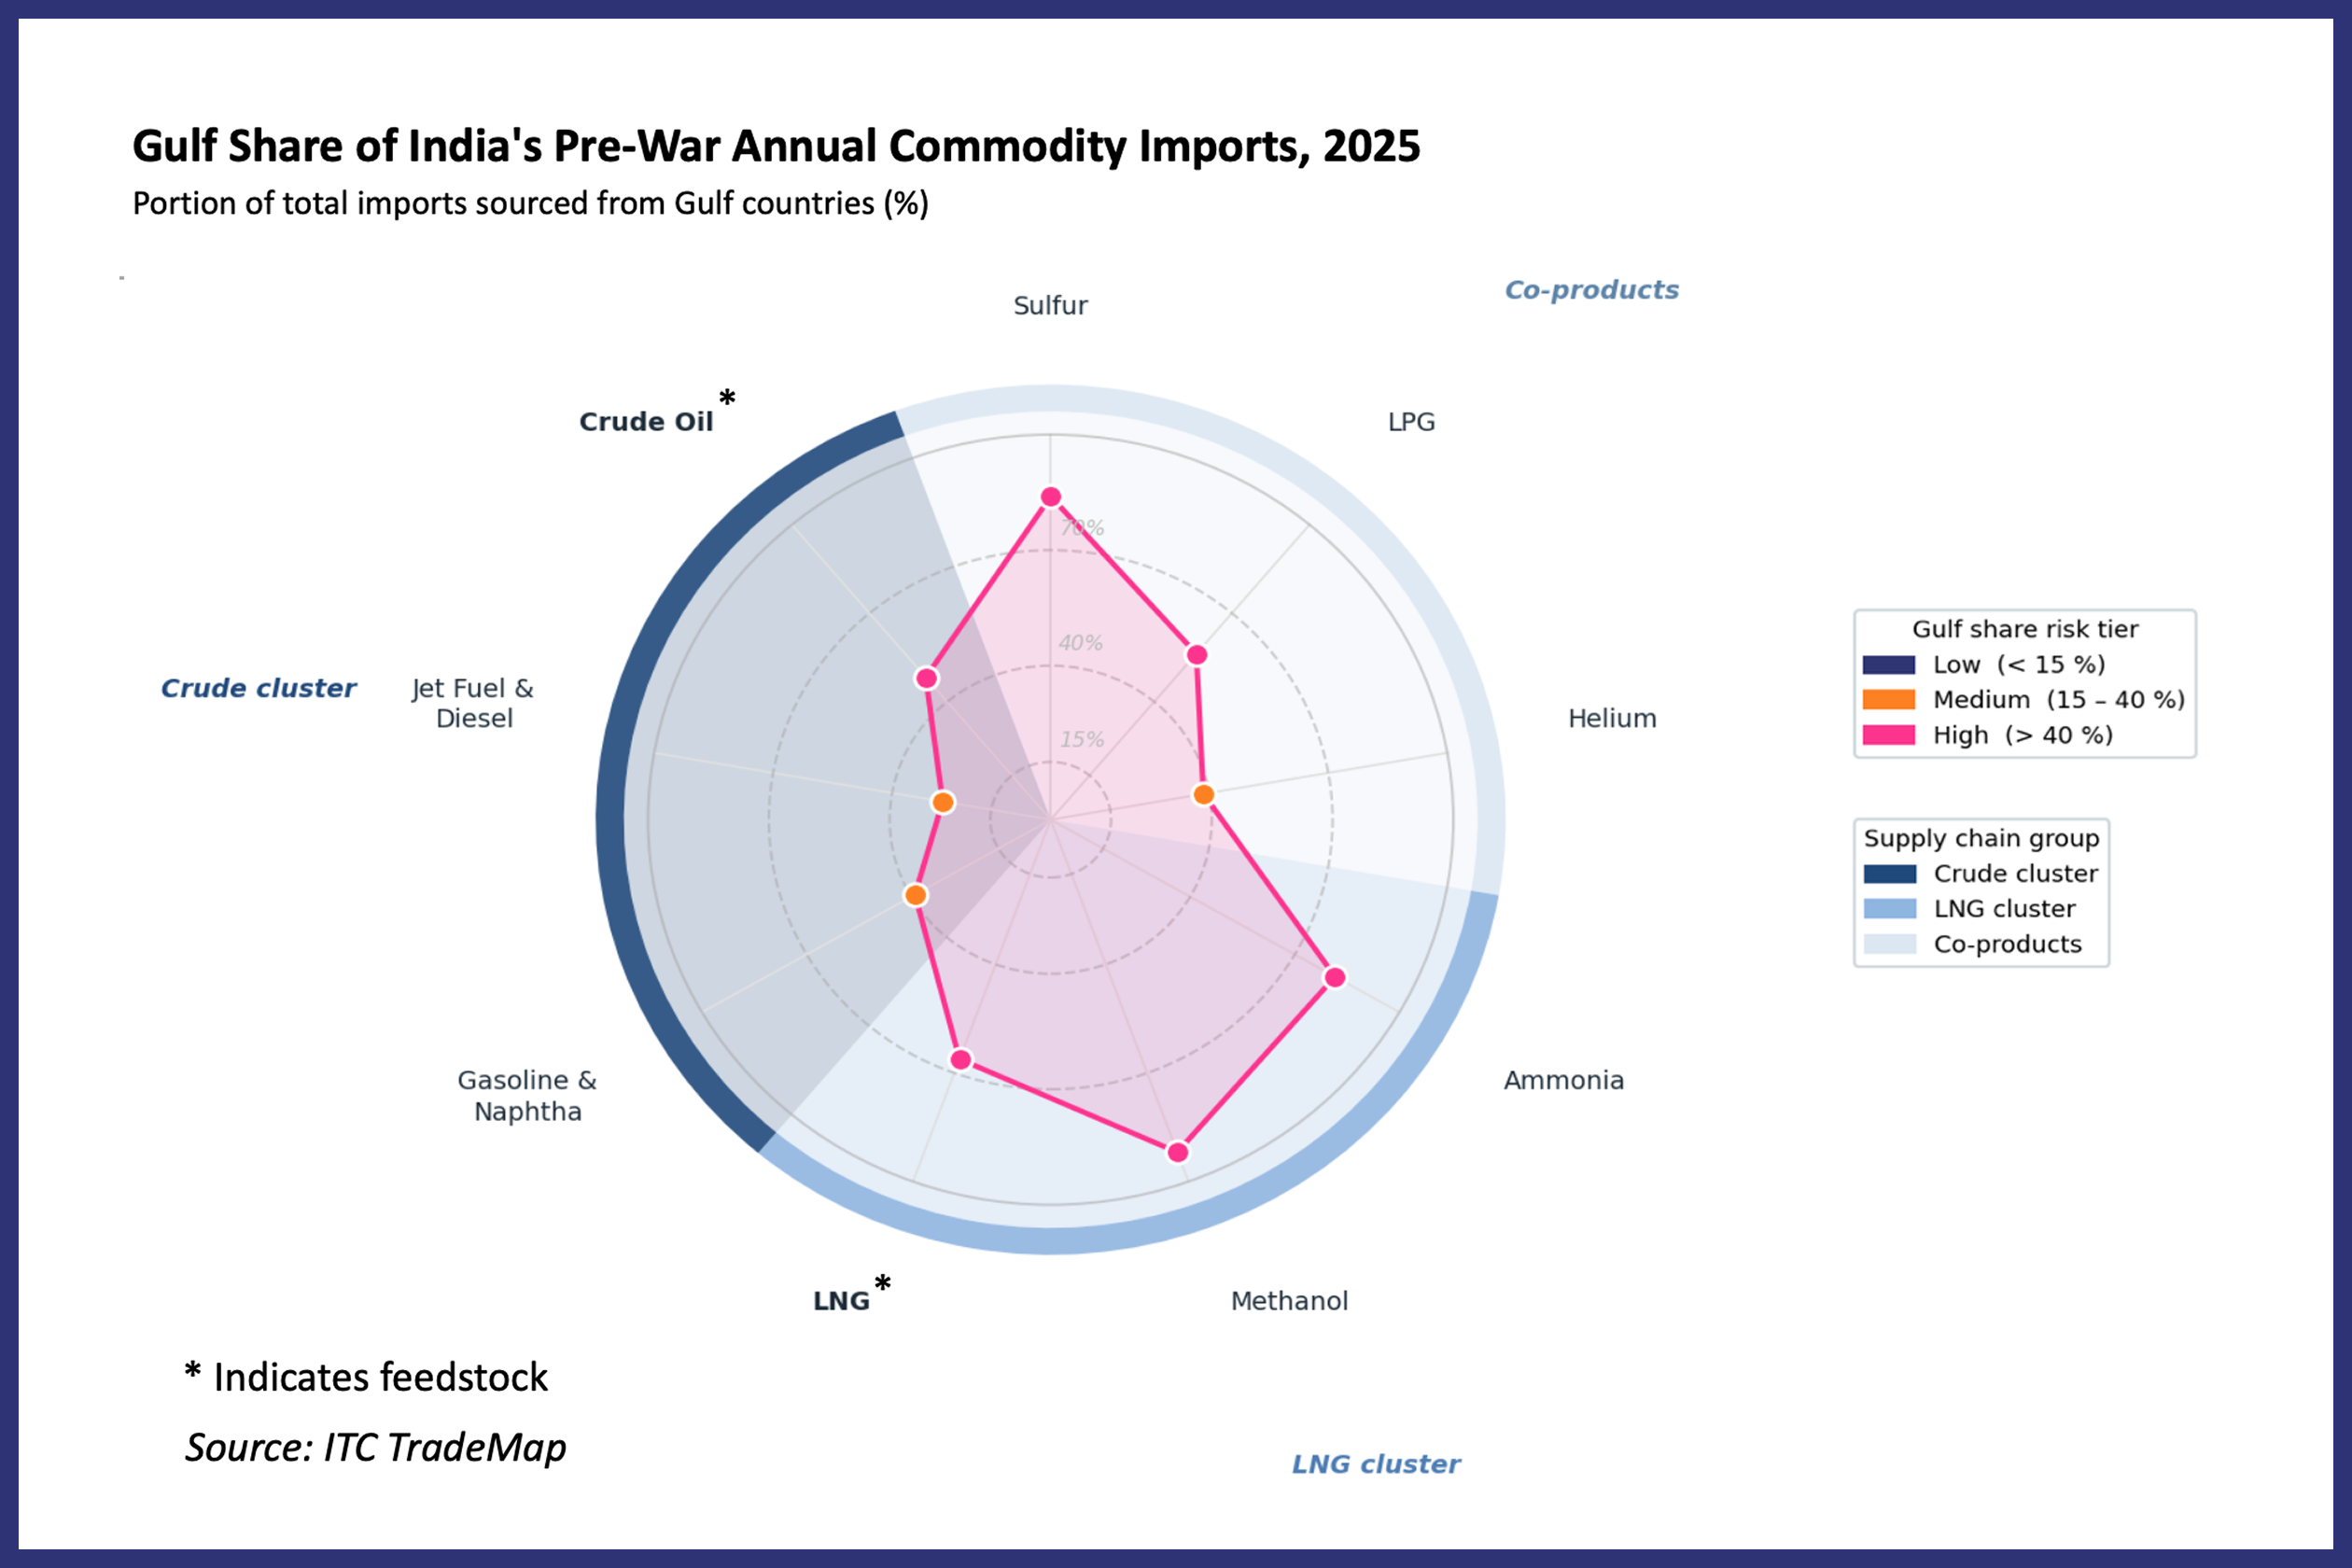
Missing Data: Estimates for India’s annual imports of gasoline & naphtha and methanol from the Gulf may be undervalued due to missing data.
Japan
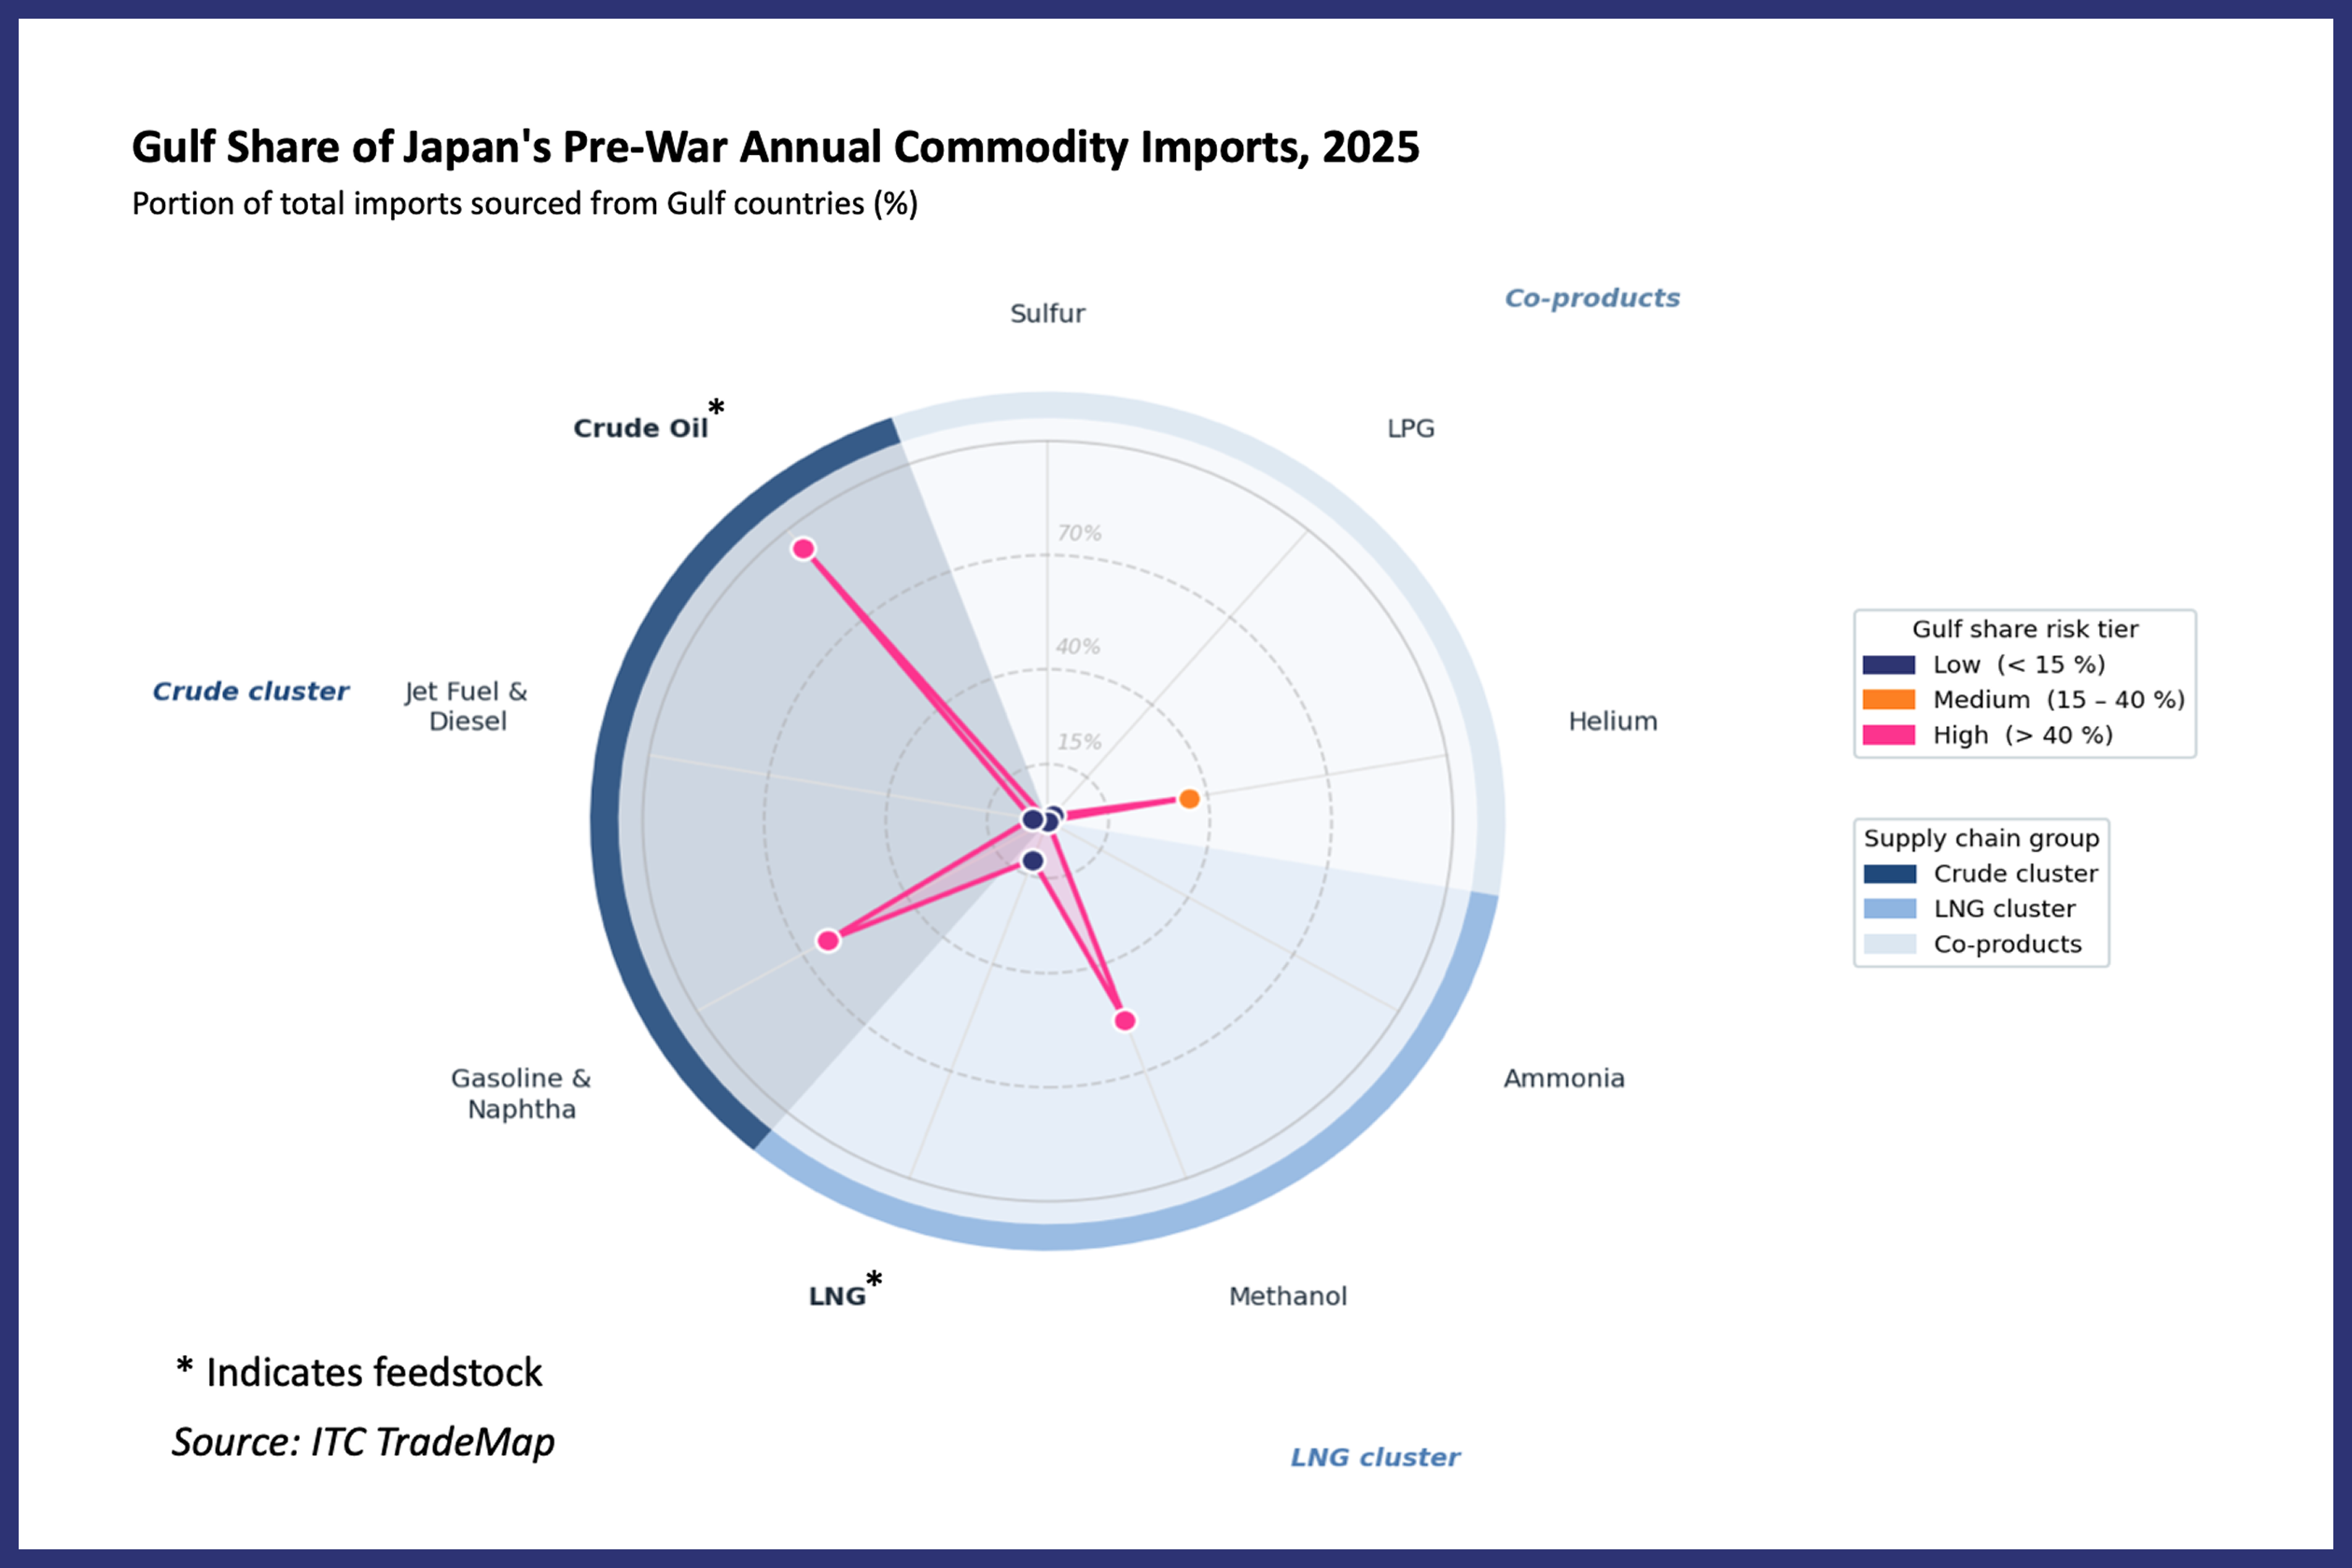
Missing Data: Estimates for Japan’s annual imports of jet fuel & diesel, methanol, ammonia, and LPG from the Gulf may be undervalued due to missing data.
Ammonia and Sulfur: Japan reported no ammonia and sulfur imports from the Gulf in 2025. It sources most of its imported sulfur from South Korea and most of its imported ammonia from Indonesia and Australia.
South Korea
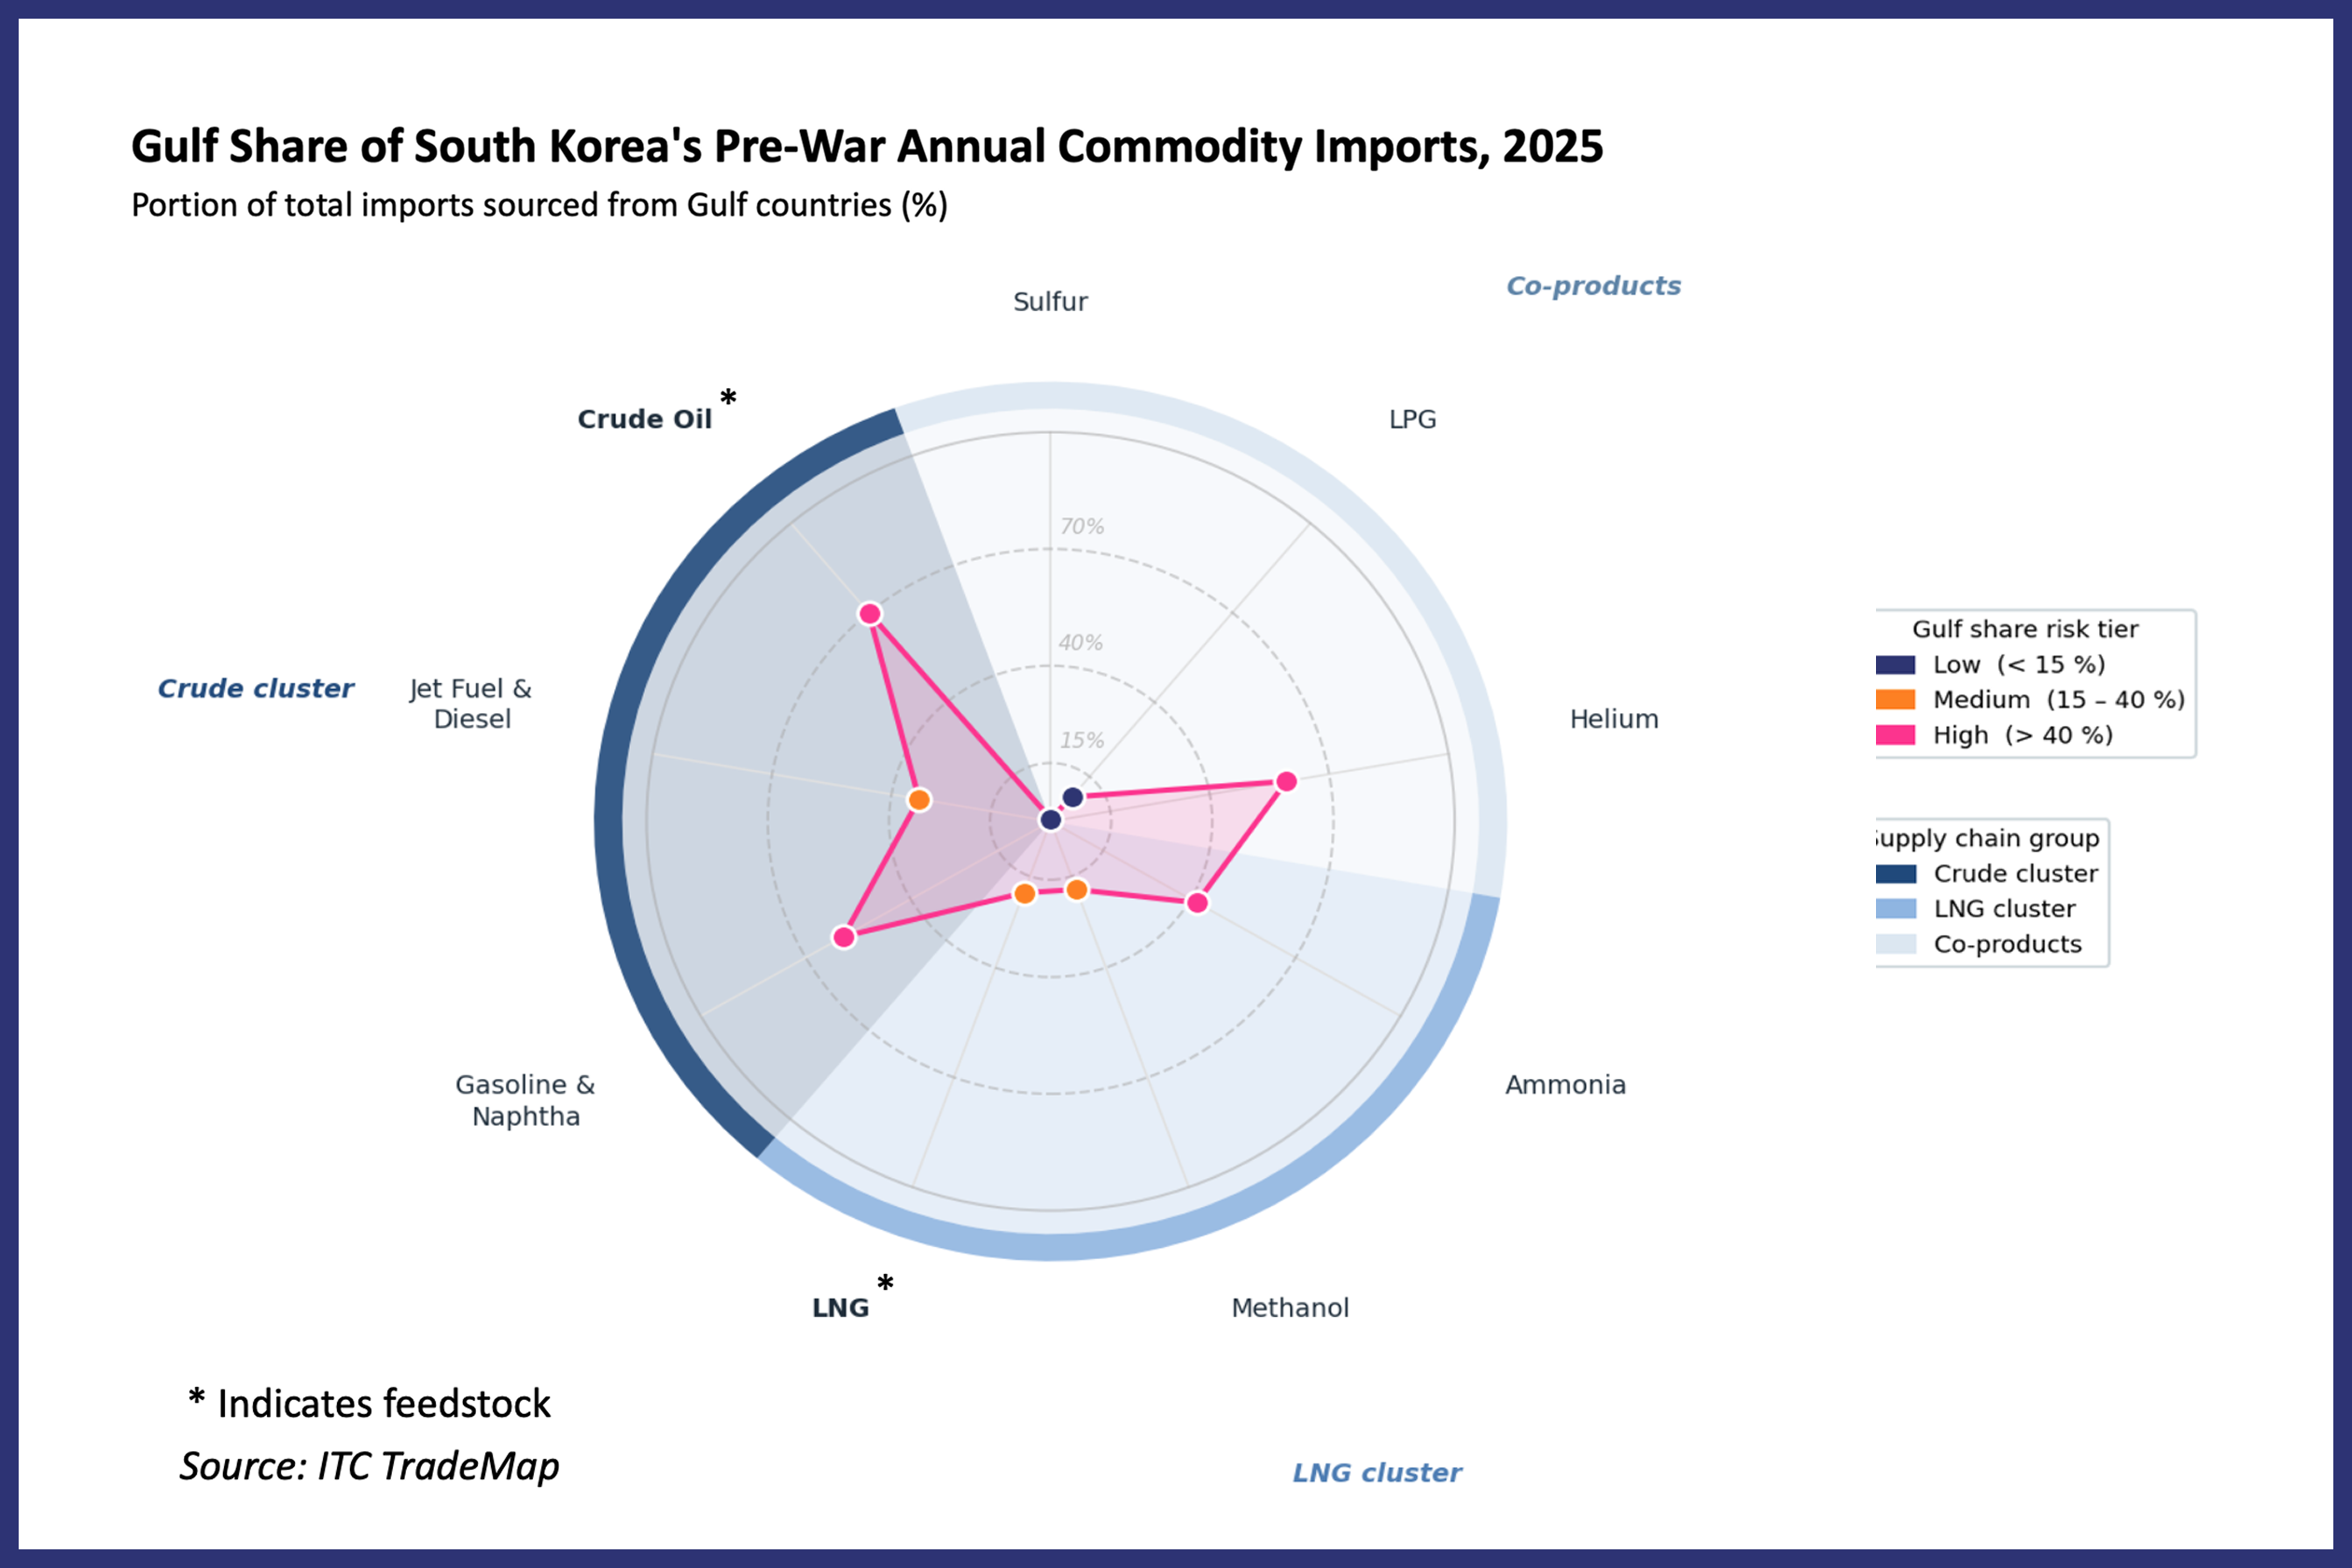
Missing Data: Estimates for South Korea’s annual imports of ammonia and LPG from the Gulf may be undervalued due to missing data.
Indonesia
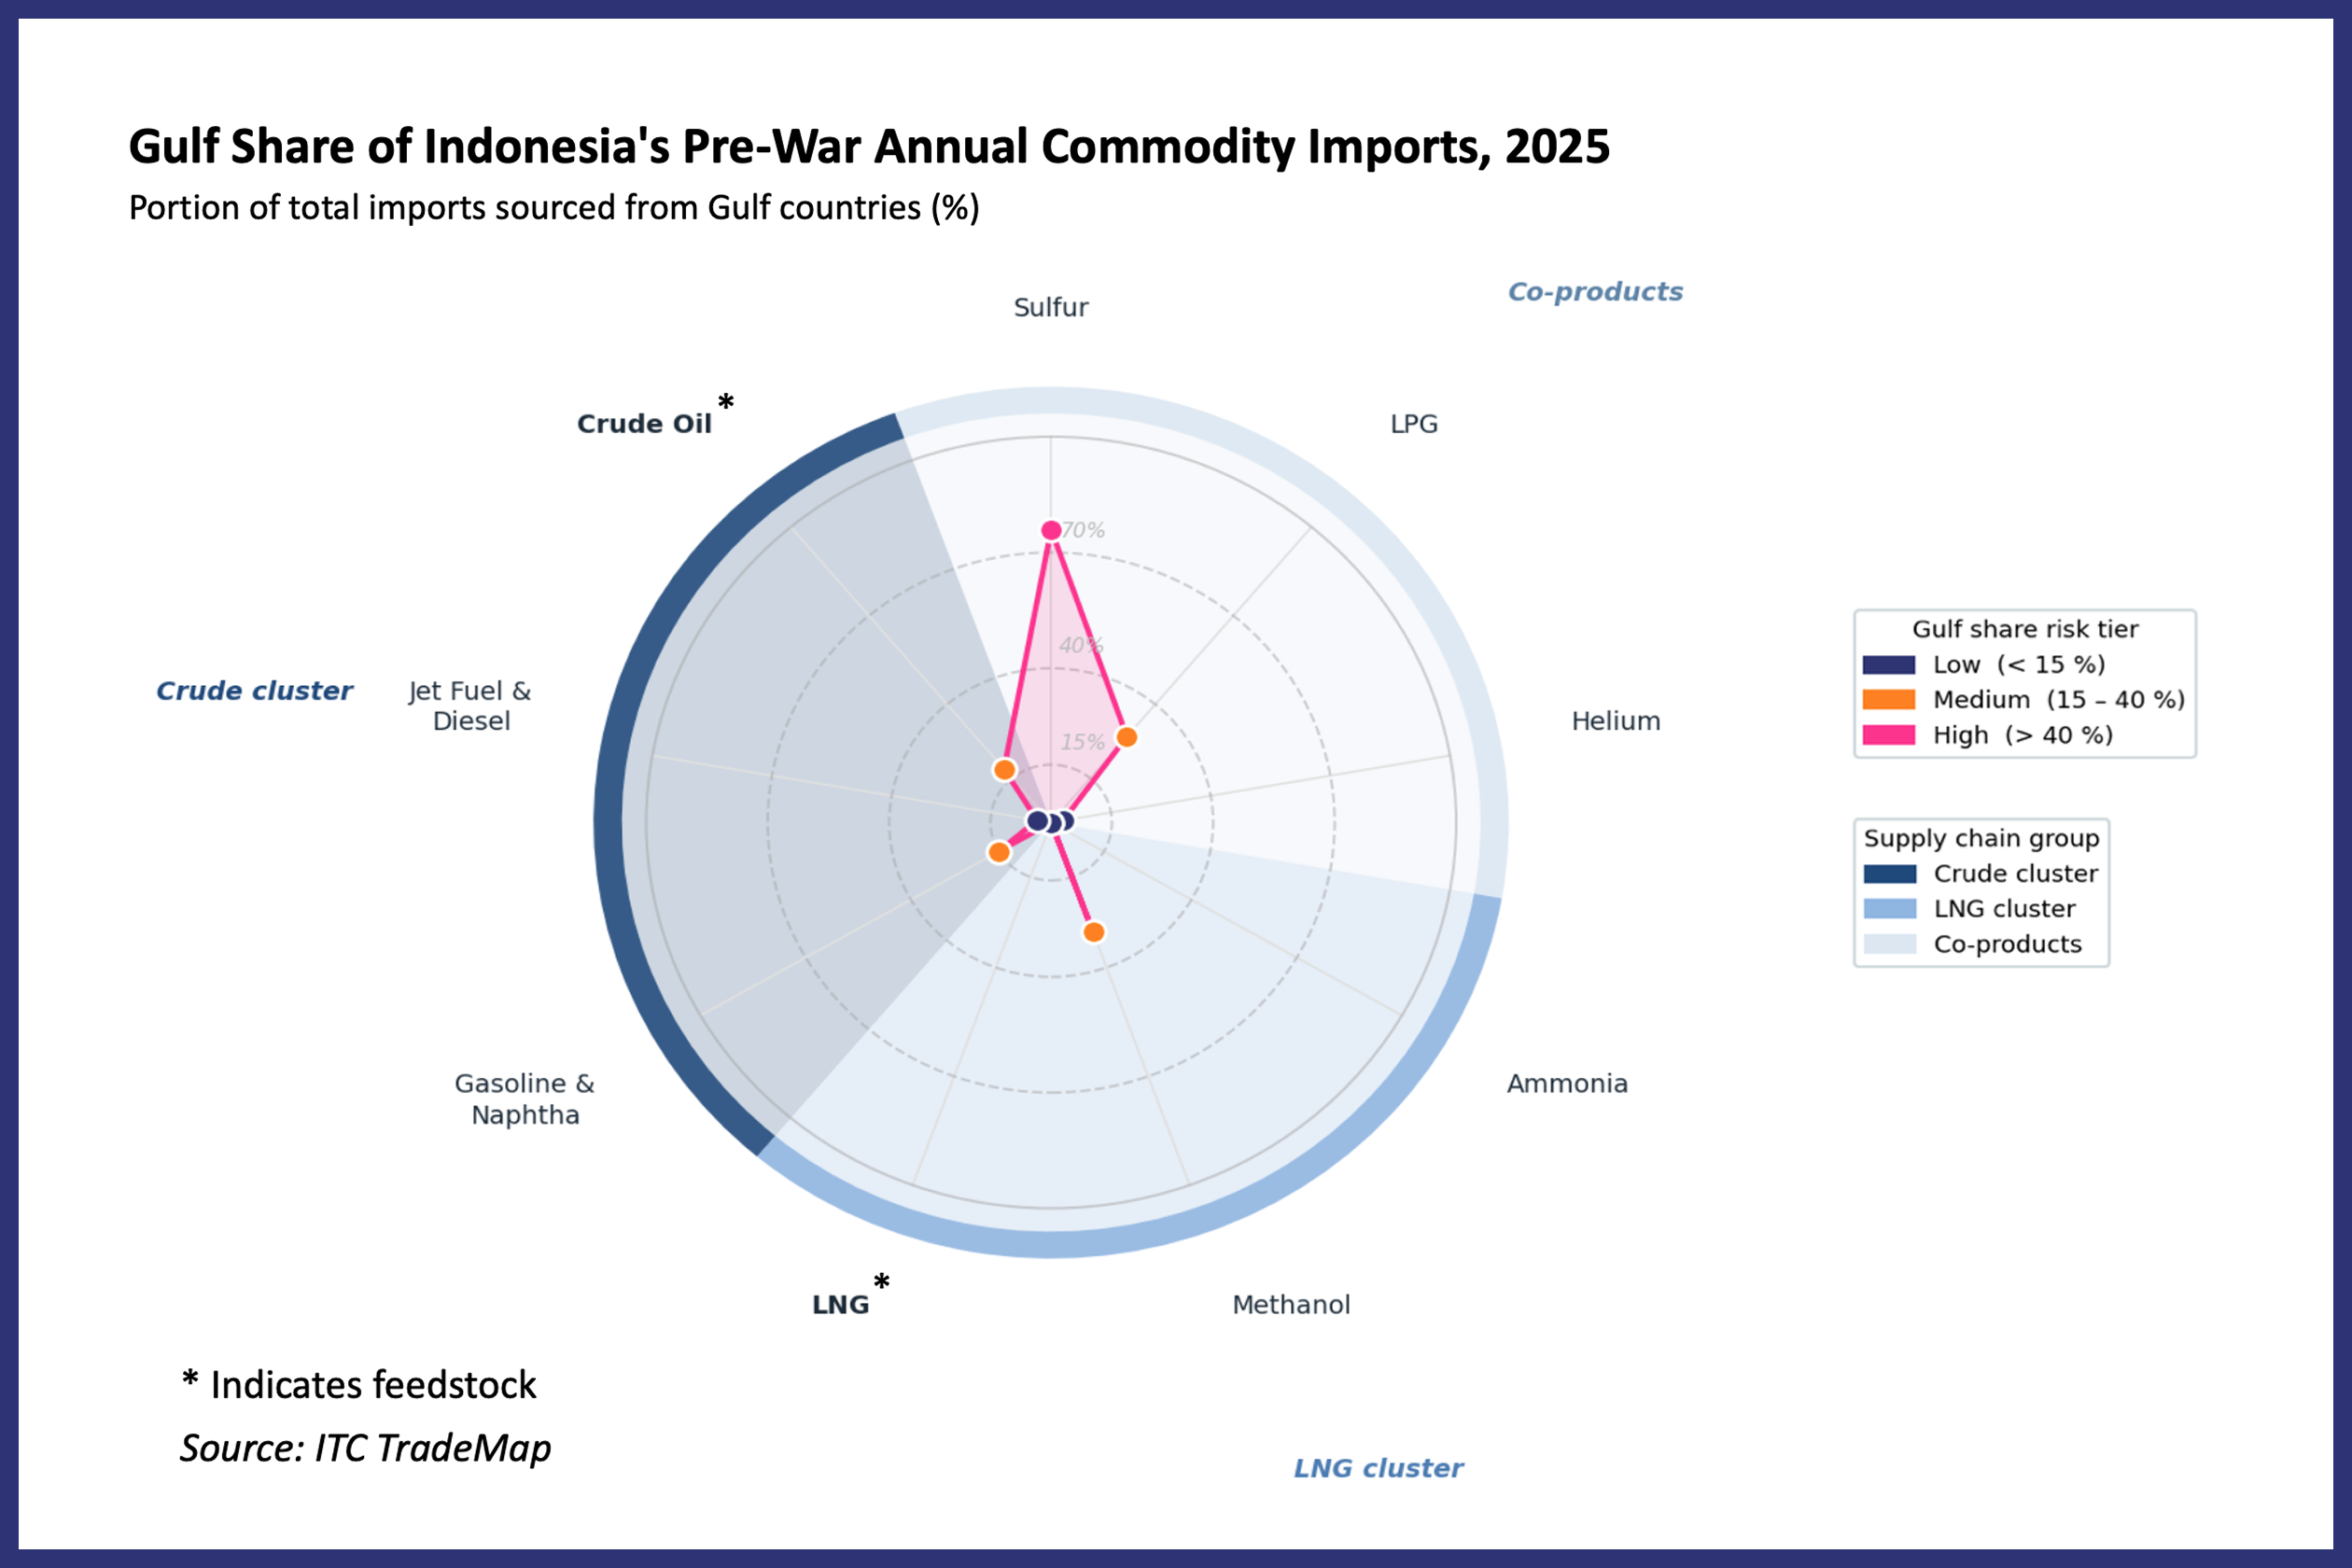
LNG and Ammonia: Indonesia is one of the world’s largest LNG exporters and has not reported LNG imports from any source for 2025. Indonesia also reported no ammonia imports from the Gulf. It sources most of its imported ammonia from Australia.
Iran: Analysts posit that following penalties imposed on Malaysian entities for transhipping goods sourced from Iran, Indonesia has emerged as a new rebranding node for Iranian crude. Those shipments appear to be routed through Indonesia rather than intended for Indonesia as a final destination.
Malaysia
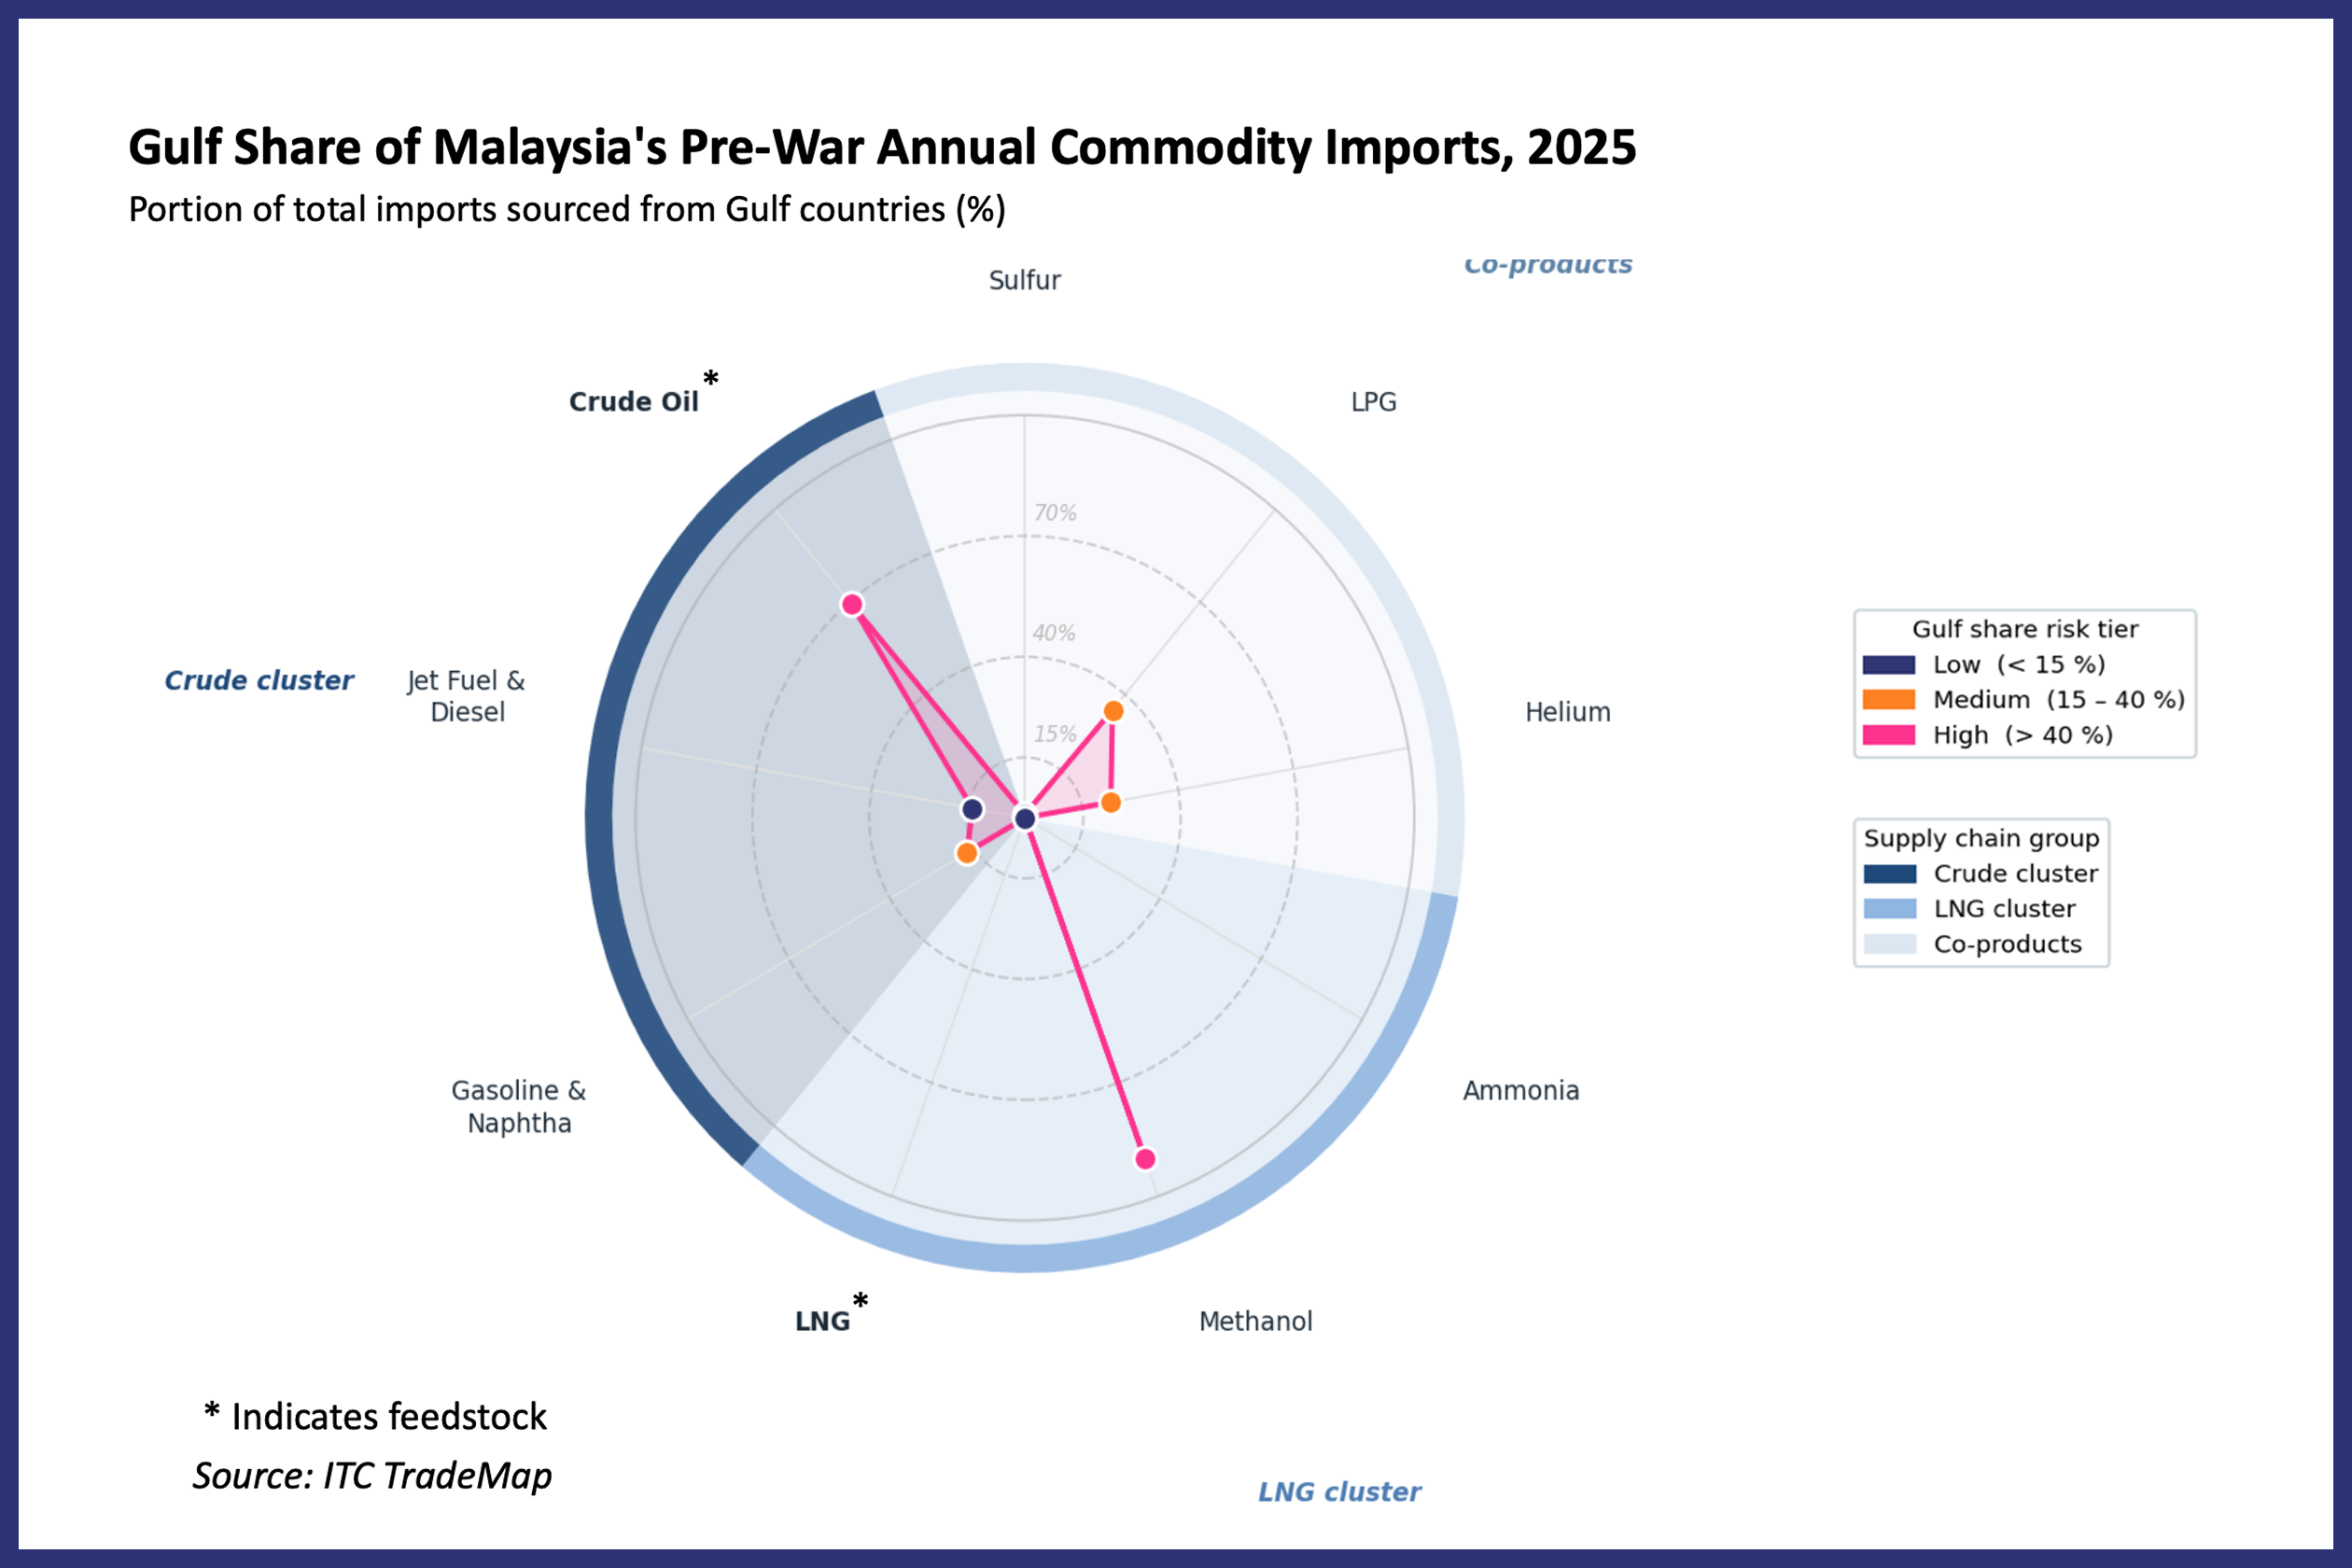
LNG and Ammonia: Malaysia is one of the world’s largest LNG exporters and has not reported any LNG or ammonia imports from the Gulf in 2025. It sources most of its imported LNG from Australia and the United States and most of its imported ammonia from Indonesia and South Korea.
Iran: Malaysia’s data may omit possible imports from Iran across commodities. Malaysia has explicitly stated it will not recognize U.S. unilateral sanctions on Iran, and Kpler data shows that Iran’s petroleum product exports, including fuel oil, naphtha, and LPG, allegedly flow via Malaysian waters to other destinations. Those shipments appear to be routed through Malaysia rather than intended for Malaysia as a final destination.
Philippines
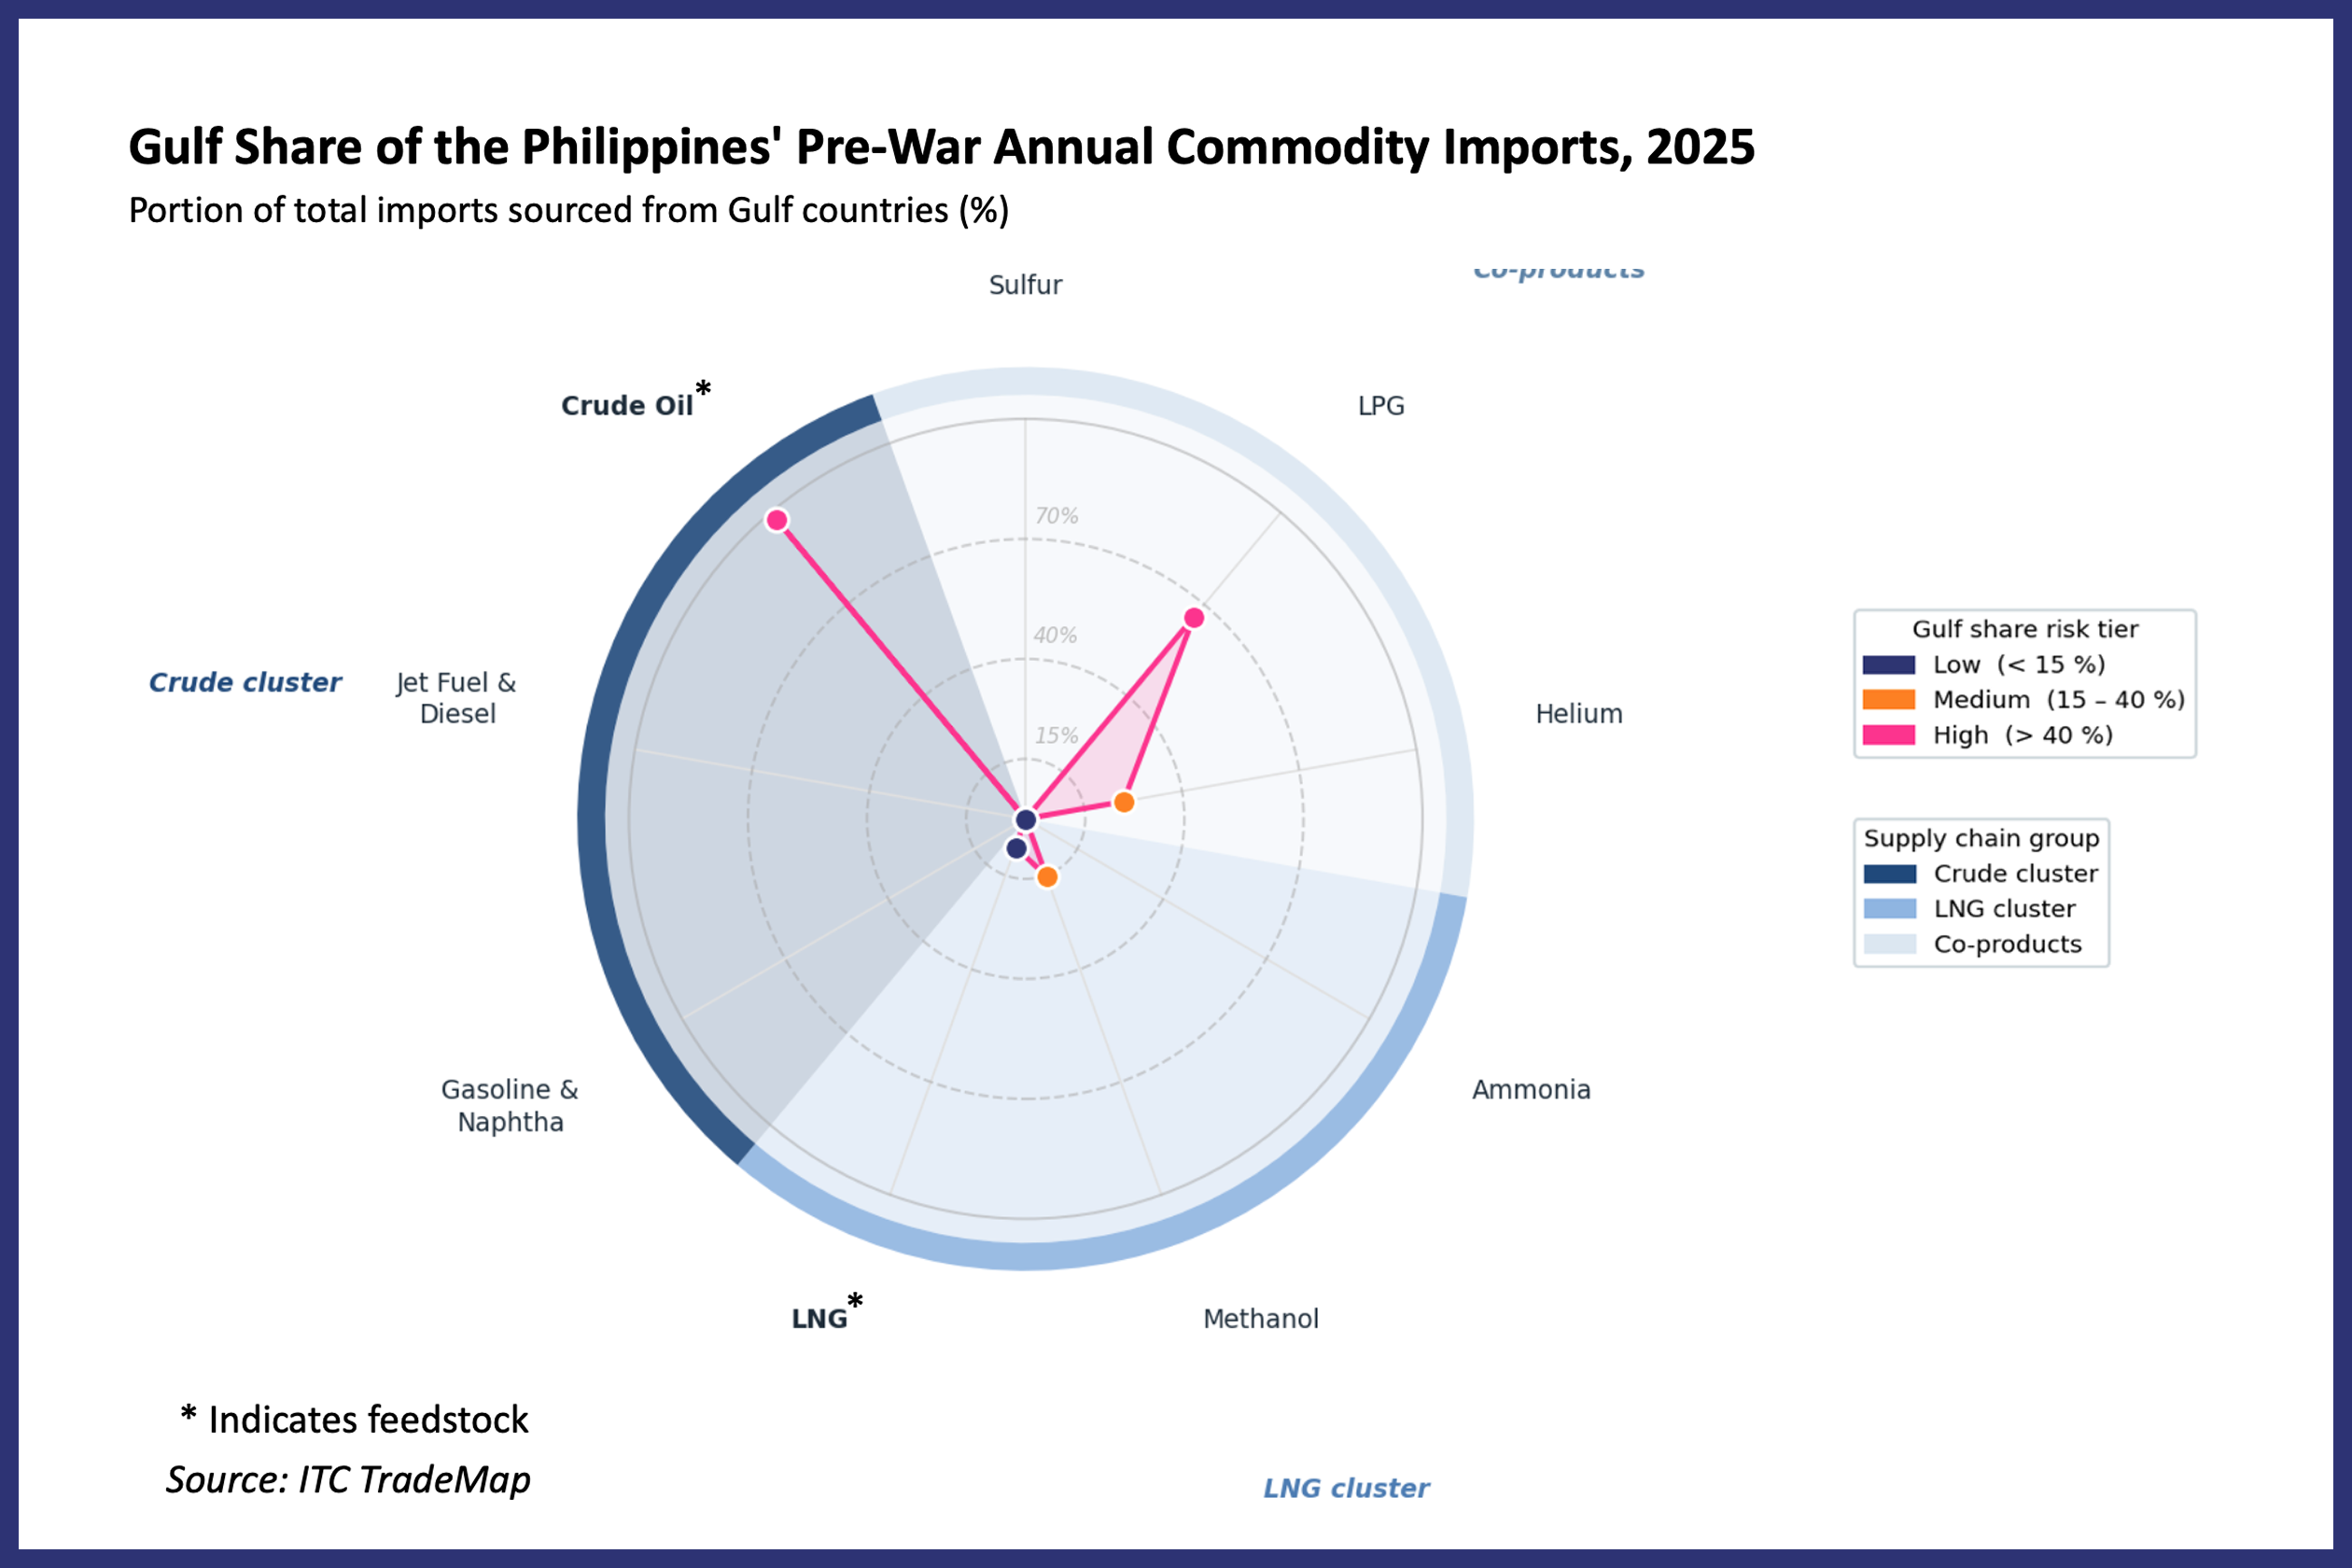
Missing Data: Estimates for the Philippines’ annual imports of jet fuel & diesel, gasoline & naphtha, and sulfur from the Gulf may be undervalued due to missing data.
Gasoline & Naphtha, Ammonia, and Sulfur: The Philippines has not reported any gasoline & naphtha, ammonia, and sulfur imports from the Gulf in 2025. It sources most of its imported ammonia from Malaysia and China and most of its sulfur from South Korea. Its fuels, including gasoline & naptha, are sourced primarily from Indonesia, China, South Korea, and the Gulf.
Thailand
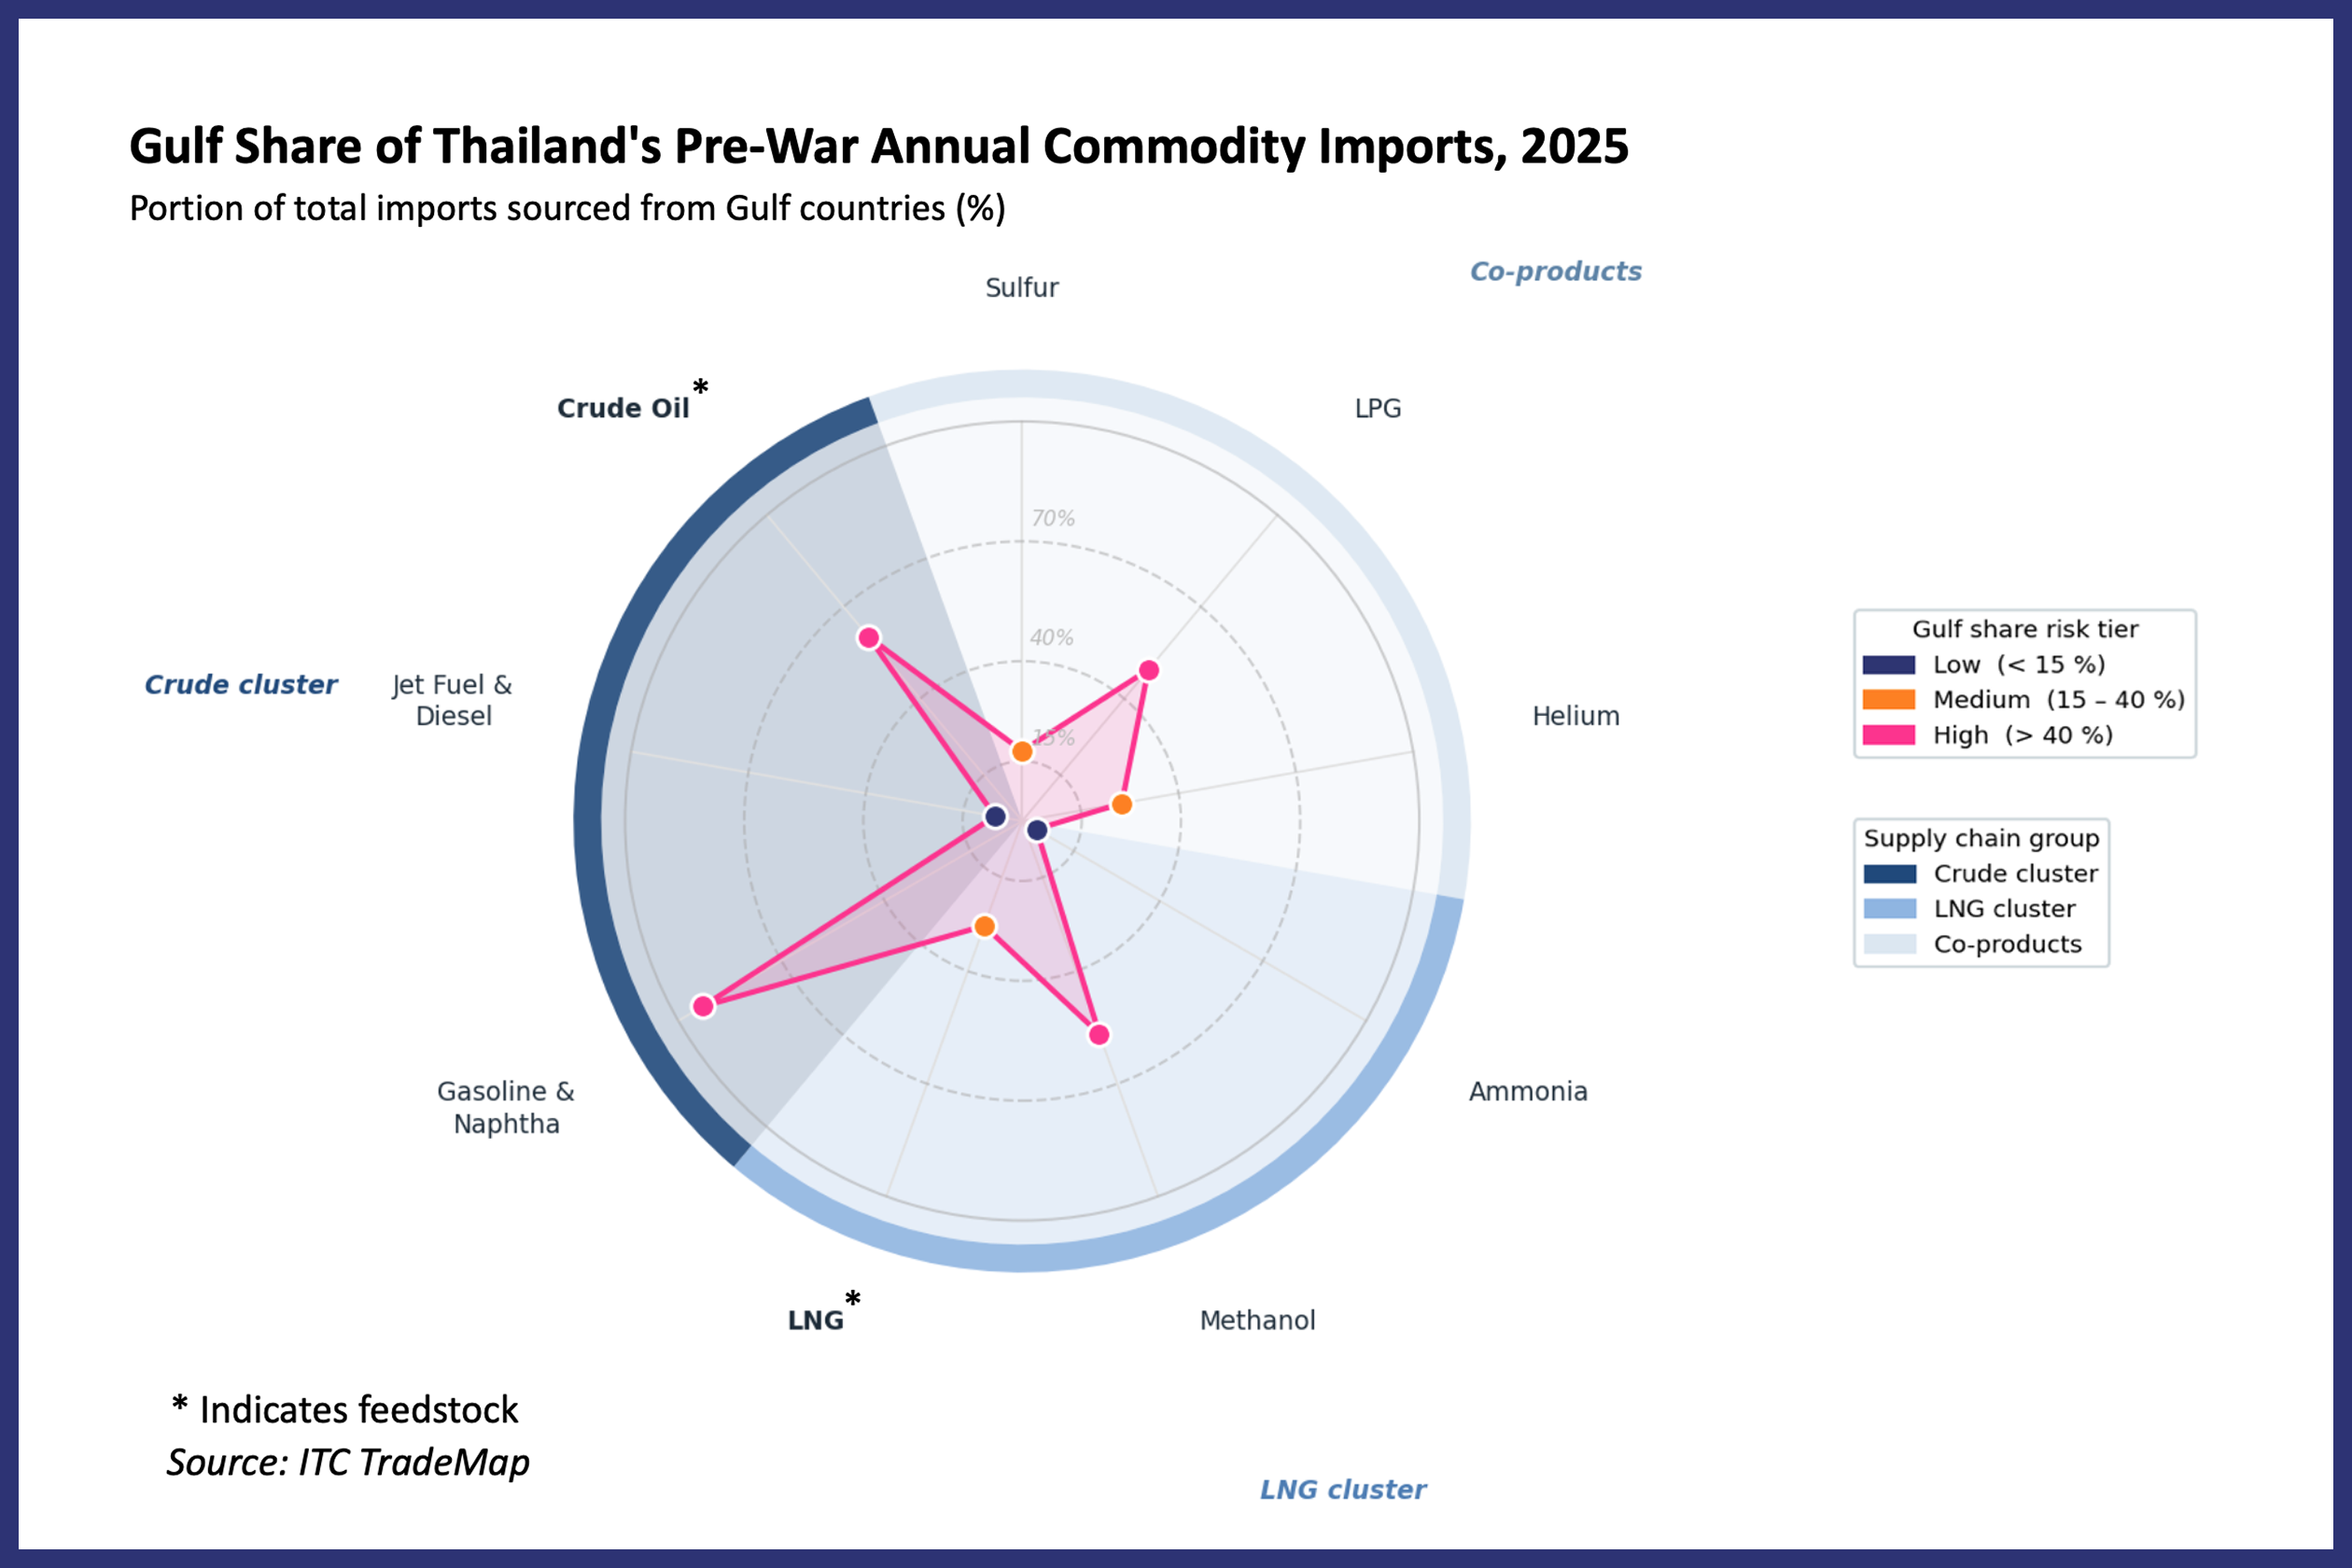
Missing Data: Estimates for Thailand’s annual imports of ammonia may be undervalued due to missing data.